Fall 2024 Senior Design Expo
Fall 2024 Projects
Project Summary
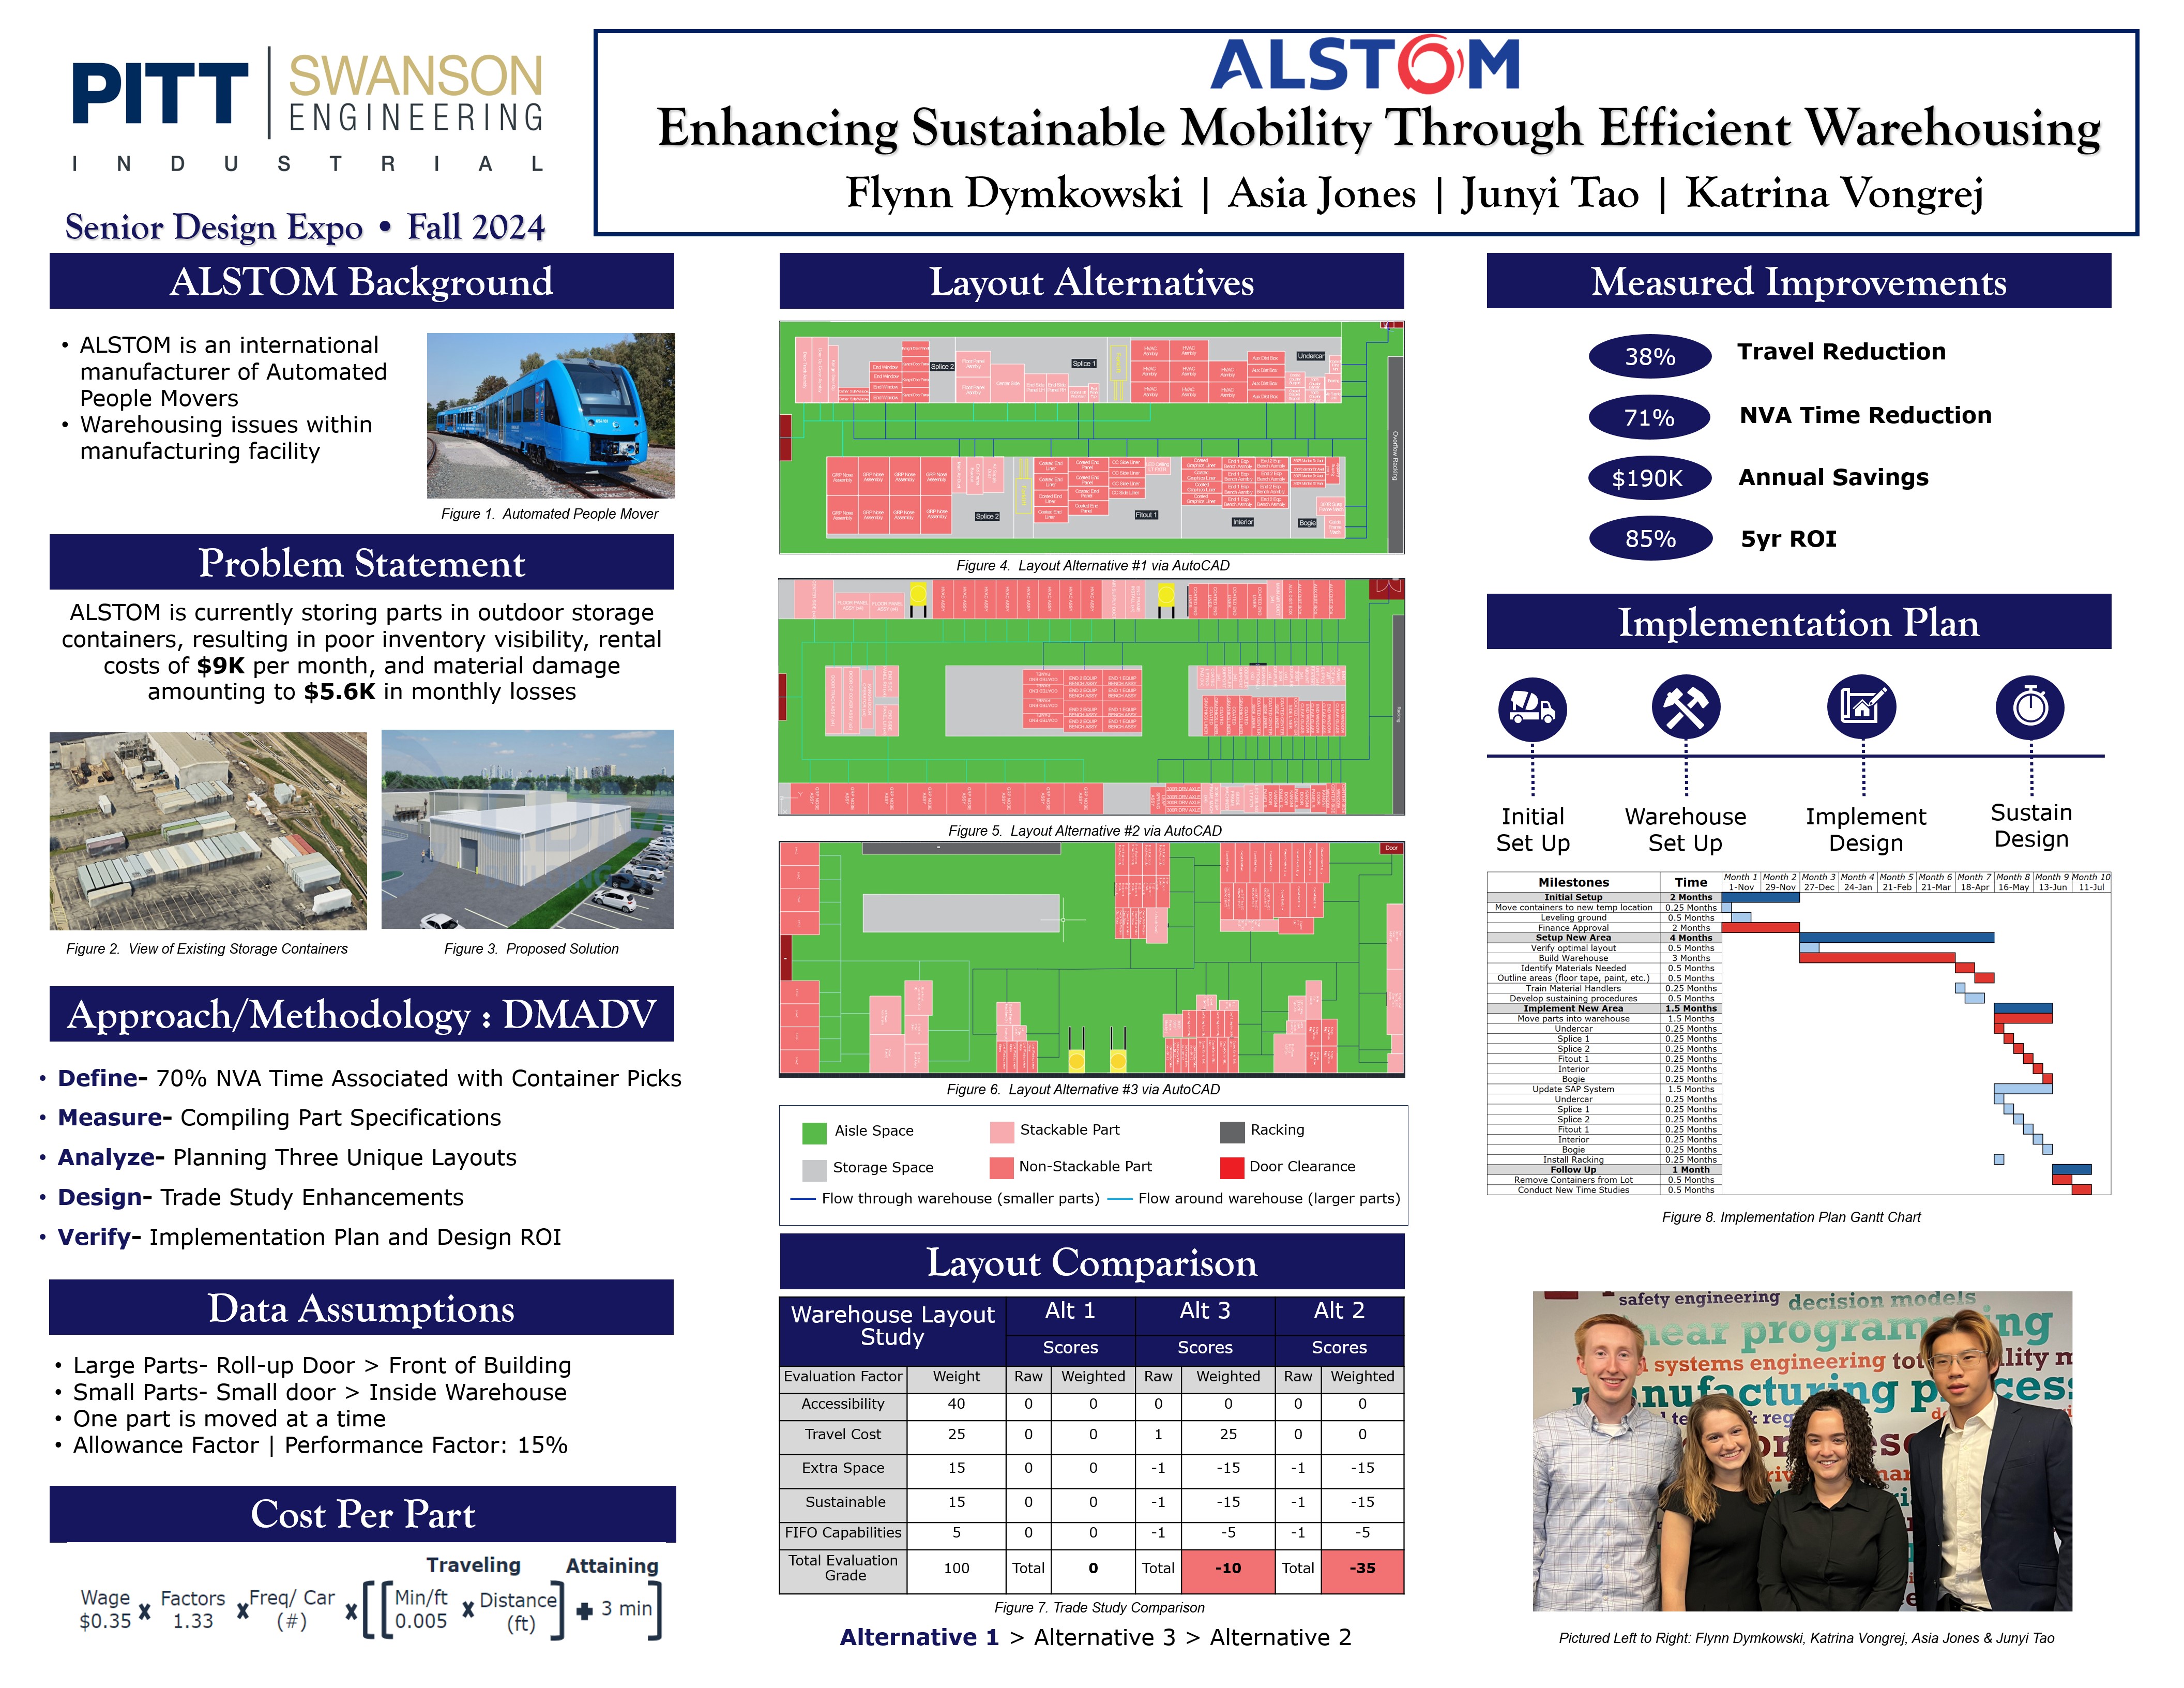
Alstom, a company specializing in designing and manufacturing Automated People Movers, operates one of its largest manufacturing facilities in Pittsburgh, PA. This site is currently facing significant warehousing challenges due to the closure of an offsite warehouse, resulting in a large influx of bulk inventory with no available storage space.
As a temporary solution to the increased inventory, Alstom engineers rented storage containers to accommodate the excess parts. Over time, 60 storage containers have accumulated in the parking lot, leading to high rental costs, material damage, and inefficient pick times, contributing to approximately $15K in monthly losses.
To address this issue, Alstom planned to construct a new semi-permanent warehouse to eliminate the need for storage containers, protect inventory from damage, and improve pick efficiency. The senior design team was tasked with designing the facility layout for the new warehouse and providing Alstom with an implementation plan.
The team began by conducting in-person site visits to understand the existing warehouse material handling and picking processes. Through time studies, measurements, and interviews, the team quantified the inefficiencies and calculated the current cost-per-part. The team also mapped the existing storage container layout to visualize part flow and distance.
Using the collected data, the team developed three alternative layouts by splitting them into sub-teams, each employing different methodologies: organizing by production line, part size, and part weight. Each layout was treated as an optimization problem, aiming to minimize part movement while adhering to constraints and standards. Iterative enhancements were made until an optimal balance between efficiency and compliance was achieved.
After completing the enhanced layouts, the team conducted a trade study (analysis of alternatives) to determine the most viable option. The five key criteria, as decided by the client, were accessibility, travel cost, extra space, sustainability, and first-in-first-out (FIFO) capabilities. The analysis revealed that the layout organized by process step was the most viable solution, a decision confirmed with the client.
After identifying the most viable layout, the team developed a comprehensive implementation plan, detailing the necessary steps and assigning task responsibilities. The team collaborated closely with the client to determine the required actions and designated accountable parties for each task. Utilizing the Program Evaluation and Review Technique (PERT), the team estimated task durations, identified the critical path, and visualized the project timeline. This information was then used to create a dynamic Gantt chart, providing Alstom engineers with a clear and actionable roadmap for implementing the new warehouse layout.
The team then calculated the improvements between the existing state and the proposed layout. The new layout resulted in a 38% reduction in travel distance and a 71% reduction in non-value-adding time, contributing to annual savings of approximately $190K. Considering the initial investment of $513K, the fiveyear return on investment for the project is 85%.
In addition to the significant cost savings, the project yielded several other benefits for Alstom. The new warehouse layout allowed Alstom to reclaim over 100 parking spaces, significantly increasing parking lot usage. The improved organization and storage conditions led to safer operating environments and extended the lifespan of machinery. Enhanced climate control within the new warehouse ensured better preservation of materials, while improved security measures safeguarded inventory. Additionally, the new layout contributed to a more aesthetically pleasing and professional appearance of the facility.
In conclusion, the implementation of the new warehouse layout at Alstom's Pittsburgh facility is set to resolve significant warehousing challenges, reduce costs, and enhance operational efficiency. The project not only addresses immediate storage issues but also provides long-term benefits such as increased parking space, improved safety, and better material preservation. With the new warehouse and layout scheduled for completion by the spring of 2025, Alstom is wellpositioned to meet its production goals and drive profitability.
Project Summary
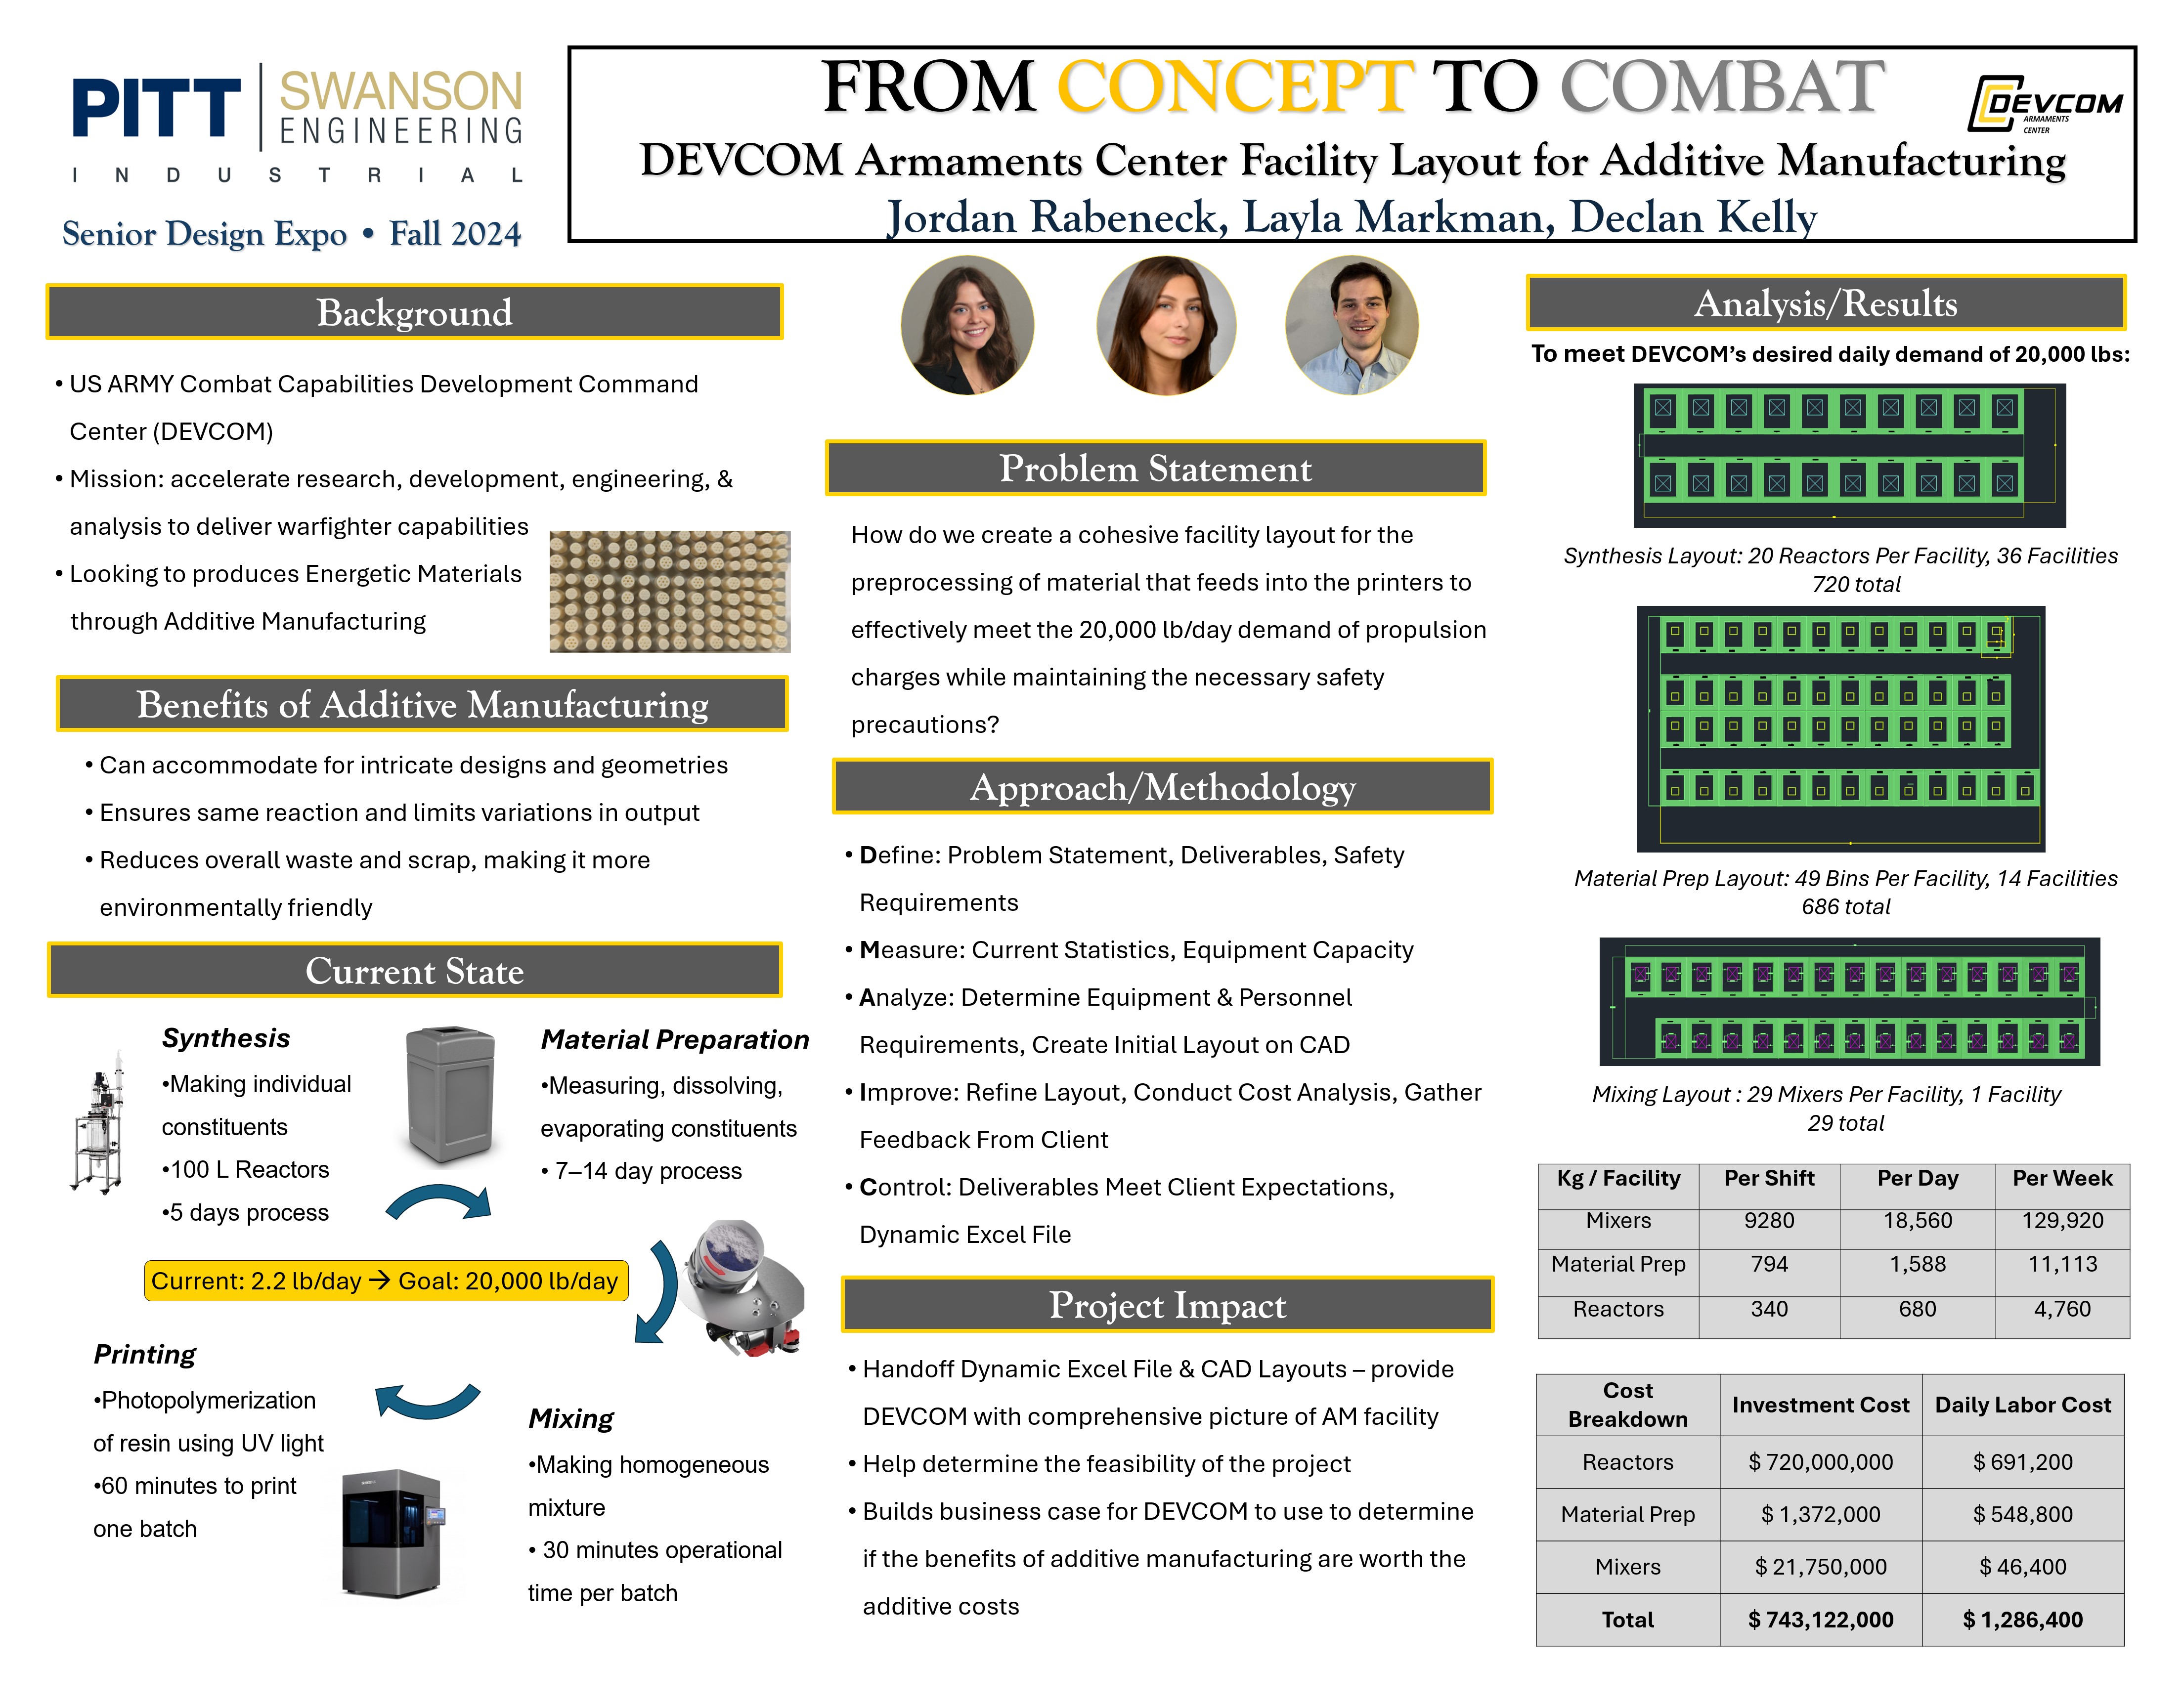
This project involves the design and optimization of a facility layout for preprocessing gun propulsion charges for the U.S. Army Combat Capabilities Development Command (DEVCOM). The primary objective is to create a safe, efficient, and cost-effective design for the preprocessing steps—synthesis, material preparation, and mixing—using additive manufacturing to scale up production. Building on previous work, we aim to meet a daily demand of 20,000 pounds while adhering to stringent safety standards.
The project employs the Lean Six Sigma DMAIC framework to guide the design process. In the Define phase, we established clear project goals and safety requirements. The Measure phase involved collecting data on current operations and equipment specifications. We determined the necessary equipment and spatial requirements during the Analyze phase to meet production goals. The Improve phase focused on refining the facility layout to optimize space utilization and cost efficiency. Finally, the Control phase ensures the sustainability of the design through a dynamic Excel tool for future adjustments.
Key challenges included adhering to safety standards set by the Department of Defense Explosive Safety Board (DDESB) and the Occupational Safety and Health Administration (OSHA) and managing the conceptual nature of scaling lab-scale production to a pilot scale. Our proposed solution features a process layout that allows each stage to operate independently, ensuring safety and operational efficiency. The final deliverables include detailed AutoCAD drawings and a dynamic Excel file to assist DEVCOM in making informed decisions as production needs evolve. Our provided recommendations will support DEVCOM in advancing its mission and enhancing operational readiness.
Project Summary
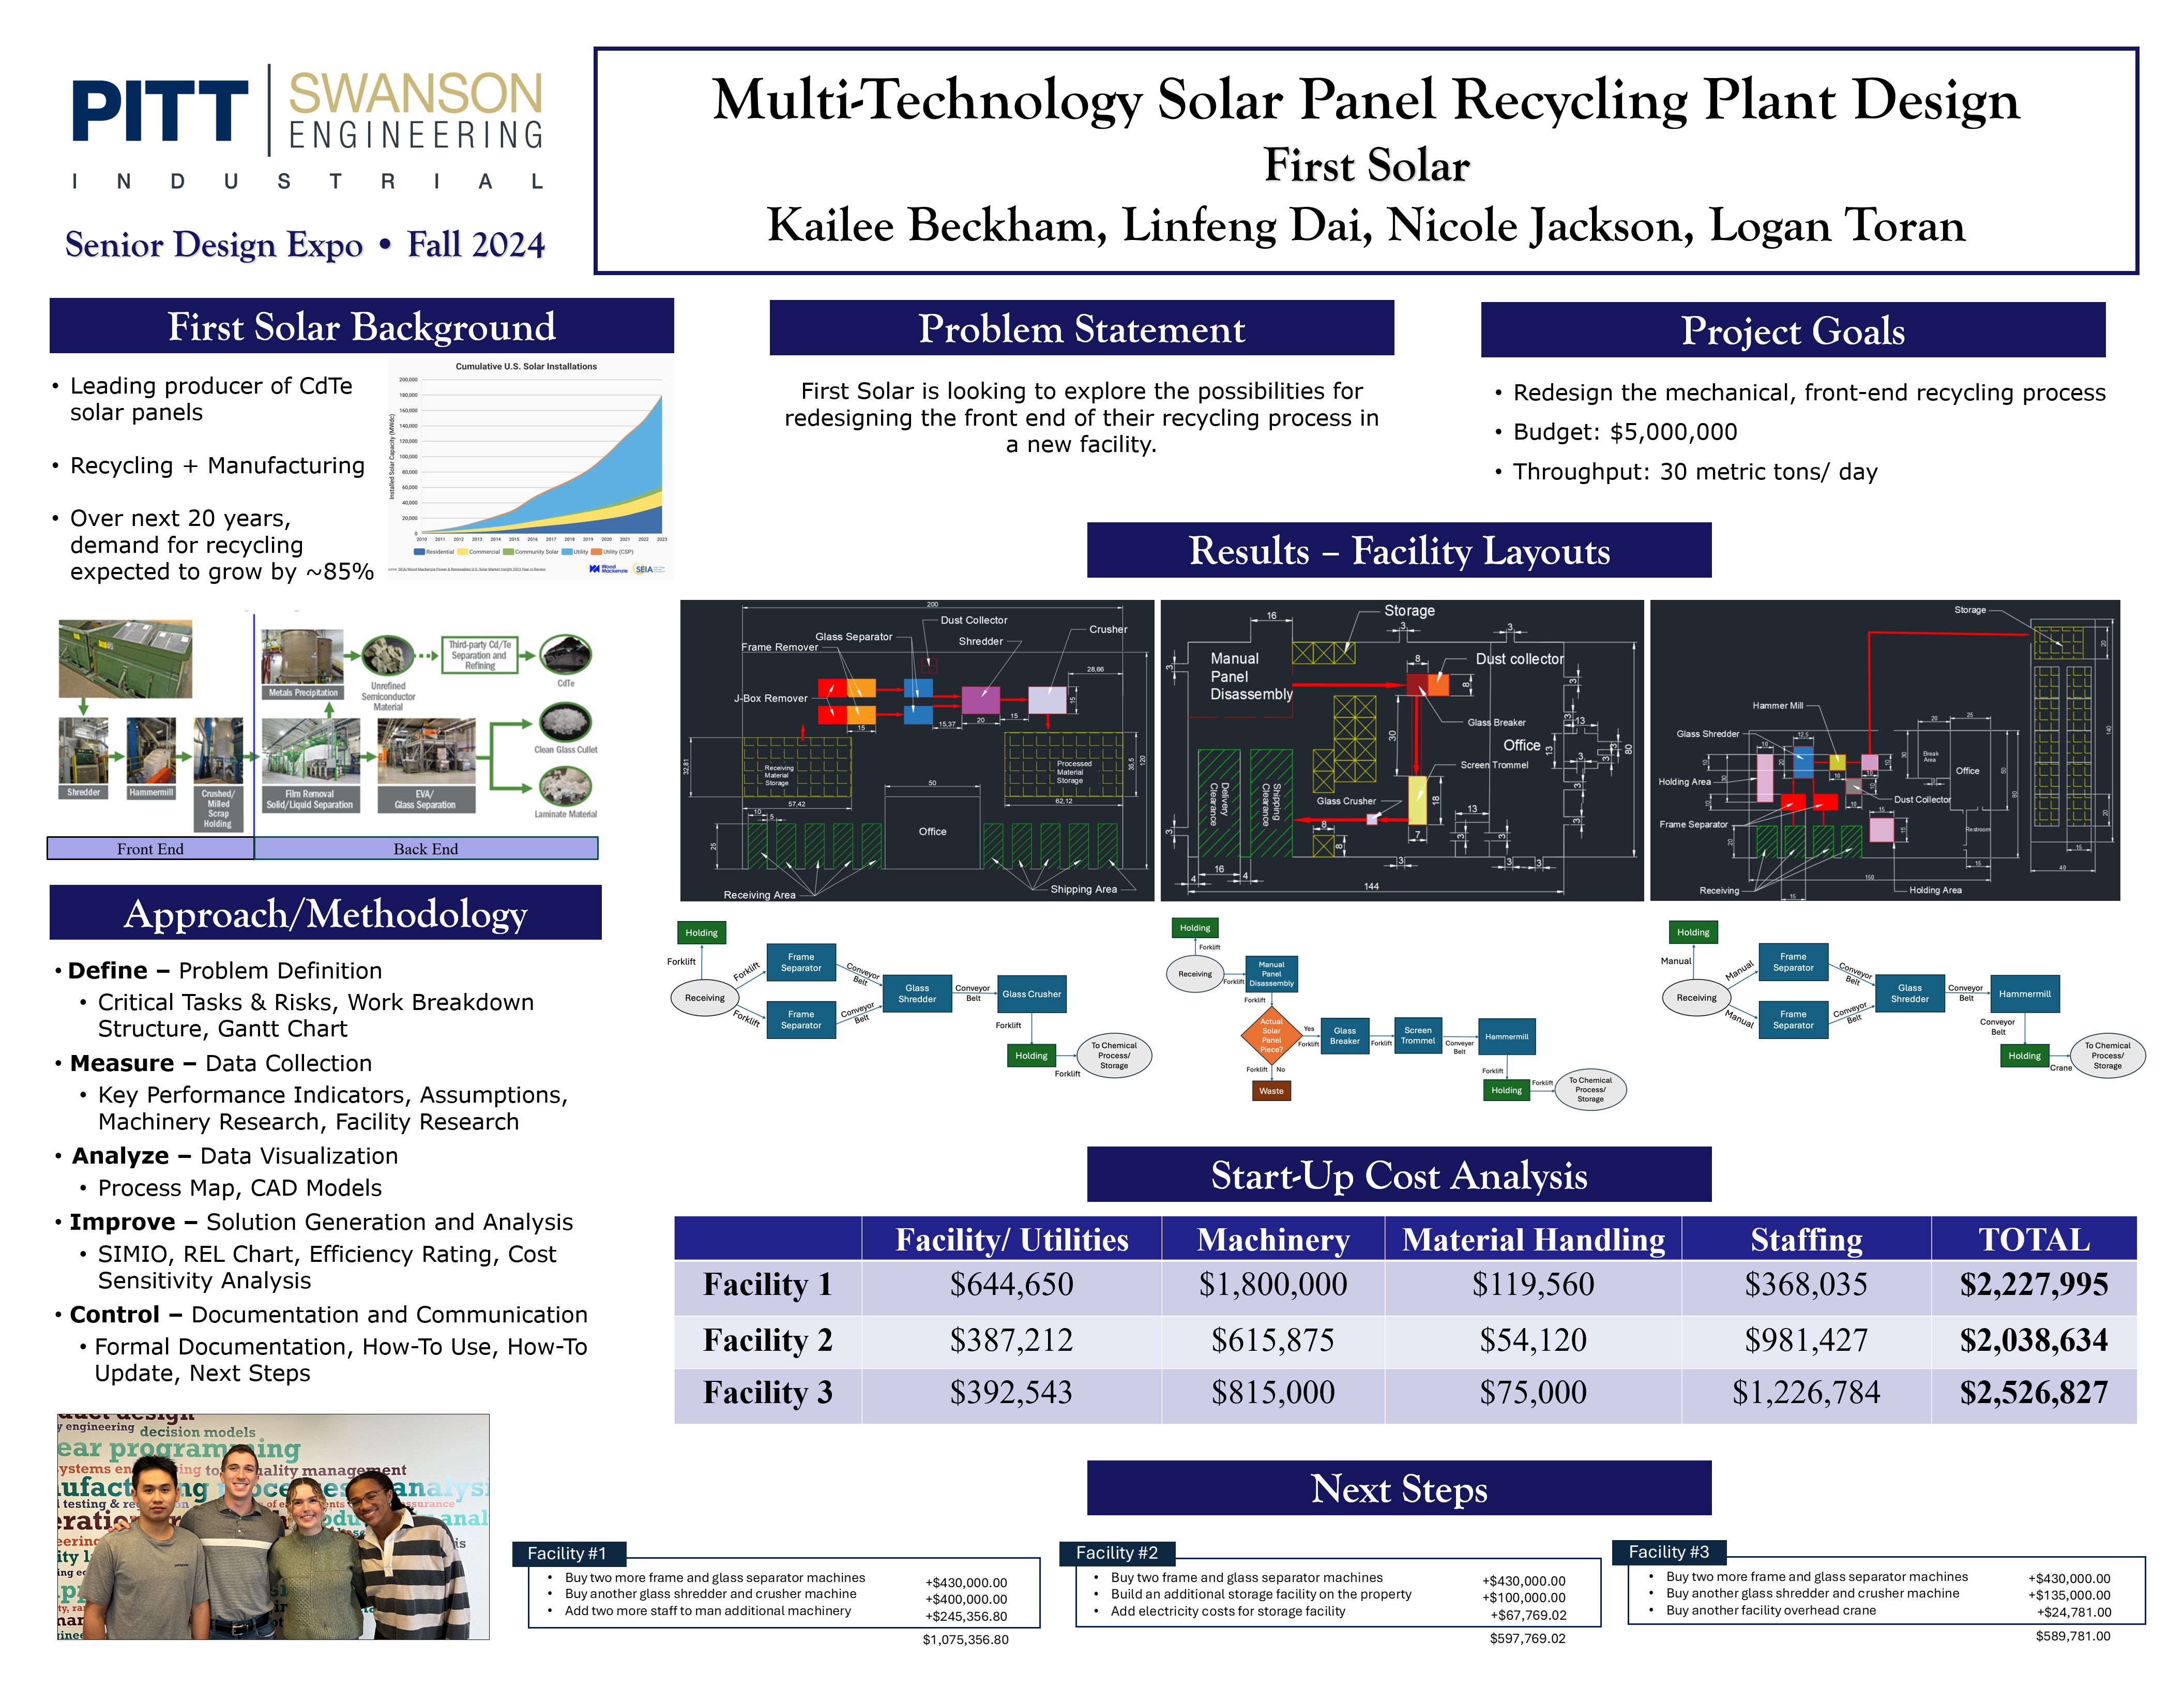
Over the next 30 years, millions of solar panels are expected to reach their end of life. During this time, many solar panel manufacturers will be looking for ways to expand their recycling operations. For this semester, the Student Team at Pitt worked with solar panel manufacturing company First Solar to redesign the first part of a two-step process needed to recycle each solar panel as it reaches its end of life. The constraints given to the team included a budget of $5 million and a target throughput for the facility of 30 metric tons of recycled material every day. To execute this, the students focused on three primary tasks.
First, the team researched facilities currently on the market that could accommodate such a production. After choosing three viable facilities, the students researched and selected machinery to accomplish the front-end material breakdown and designed facility layouts incorporating the machinery. With each of these proposed layouts, the students investigated material handling methods that could safely and effectively move the broken-down material throughout the facility. After completing machine and material handling, CAD models were built to represent the facility and the material flow through each. With each facility laid out, the students were able to analyze each. The primary components measured were the cost and throughput capacity. A full cost breakdown was calculated for each facility consisting of the building itself, machinery, material handling, and staffing costs. A final throughput capacity was also calculated for each facility.
After the analysis was complete, facility #3 did the best job of accommodating the expected growth in demand for solar panel recycling. This facility features an extra storage component that can be used to house the recycled material or panels waiting to be broken down. This ensures the facility does not need to stop operations because there is nowhere to store the processed material. Facility #2 was the most cost-effective option however and still meets the target output goal of 30 metric tons of material per day. Facility #1 is the most highly automated of the options, which is a benefit in terms of safety, fewer staff are required to be in the production area. All three facilities came under budget and met the target output, thus creating a sound launching point for First Solar to expand its operation in the coming years.
Project Summary
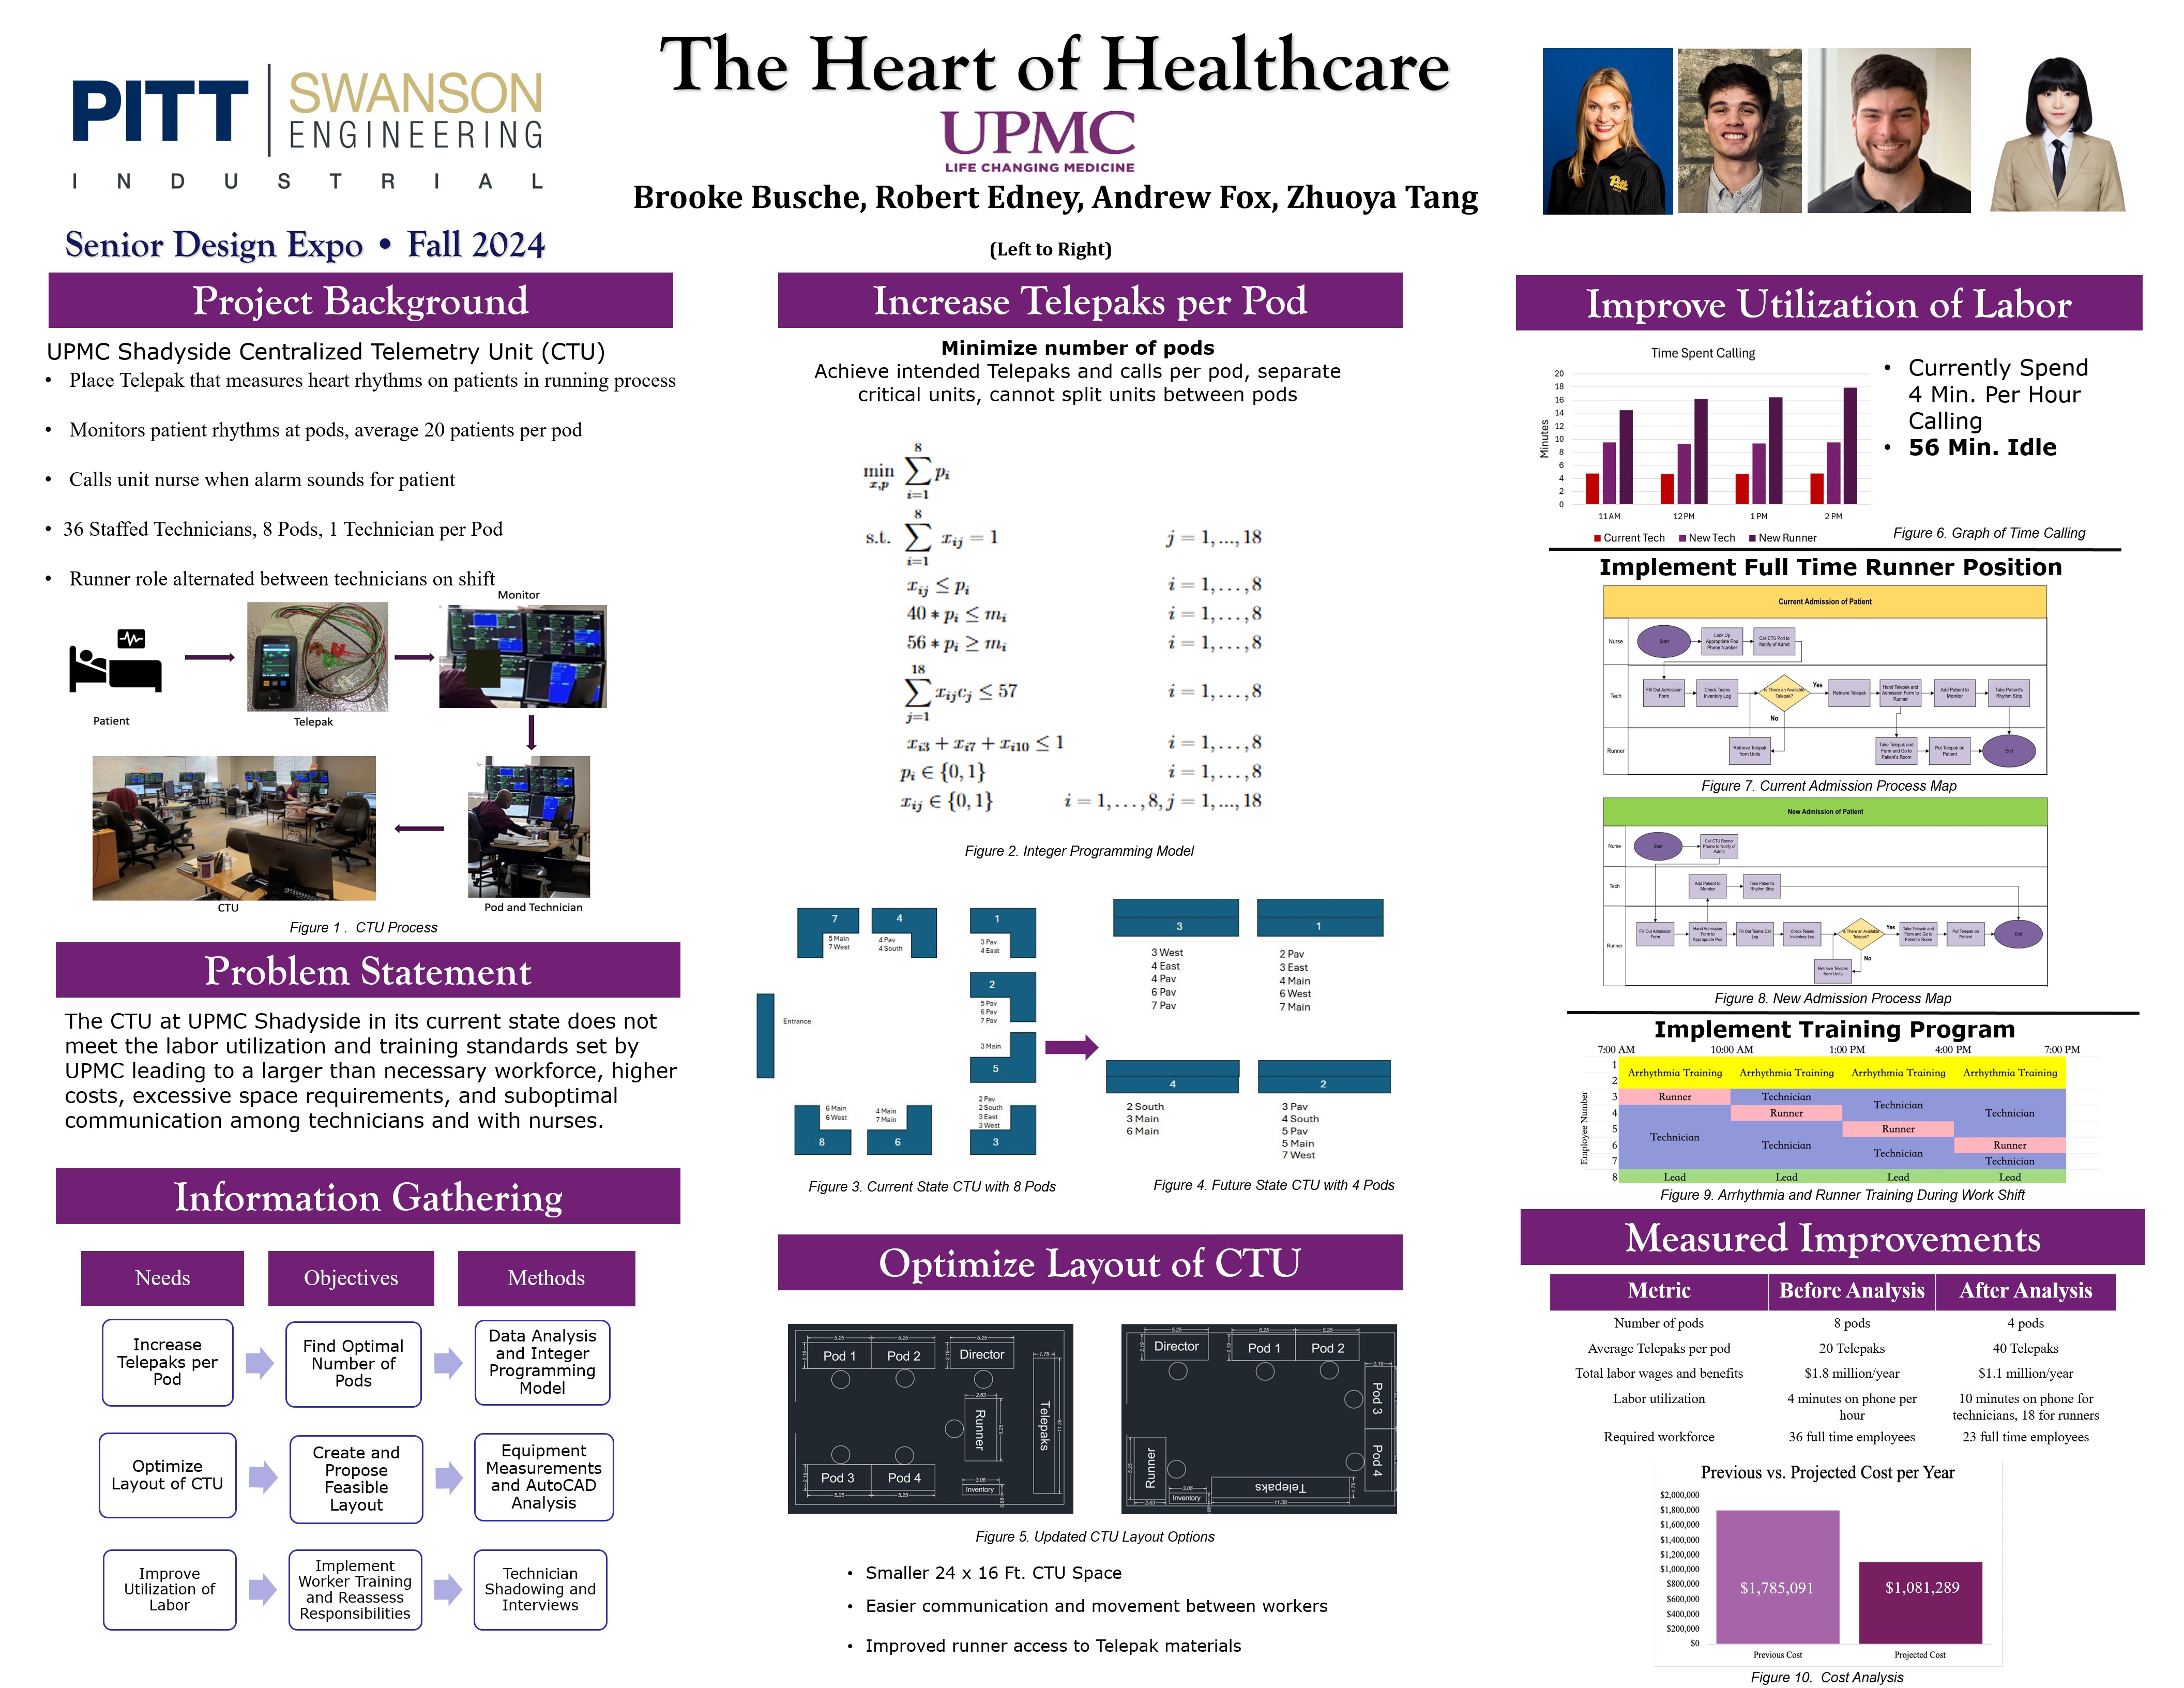
The central telemetry unit at UPMC Shadyside UPMC Shadyside has a Central Telemetry unit, or CTU, responsible for monitoring the heart rhythms of patients and making emergency phone calls to nurses. When a patient at Shadyside is in need of monitoring due to heart concerns, the nurse makes a call to the CTU. A CTU technician, in a process known as running, goes to their room and attaches a Telepak, a small device for detecting heart rhythms, to the patient. They return to remove the Telepak when the nurse deems the patient in good enough condition to stop monitoring. The CTU then has the ability to look at the rhythms and other crucial cardiac information tracked by that Telepak on computer monitors.
The CTU in its current state has 8 pods with several monitors, and each pod has 1 technician operating it at any given time. There are 18 hospital units with specific functions, and all the heart monitors in each unit are assigned to a singular pod for more streamlined communication with the nurse in that unit. When an alarm sounds on the computer monitors, the CTU technicians call the nurse of that unit to inform them of a potential emergency. The CTU technicians rotate every four hours which of them is in charge of running, and another technician observes their pod when they leave.
However, the CTU unit does not meet the productivity standards of other UPMC locations. Each pod tends to be responsible for a max of 20 patient Telepaks at any given time, while other UPMC locations are capable of averaging 40 and having up to 56 at busy times in each pod. As a result, labor utilization is very low and costs are high. In addition, technicians at UPMC Shadyside are not trained to read heart rhythms. Nurses have complained to CTU managers about this lack of expertise, saying they are often overwhelmed during their busy shifts and are unable to determine which patients are of the highest priority. Furthermore, the Shadyside CTU uses a much larger space than necessary, and hopes to relocate so that the current room can be used by other crucial hospital departments with need for more space.
The goal of this analysis was simple: increase labor utilization and decrease costs by reallocating hospital units to less pods, implement better worker training and communication, and determine space requirements for the CTU. This was done by conducting technician interviews, recording observations of the CTU at Shadyside and other UPMC locations, and analyzing data taken by both CTU workers and the student team.
In the end, an integer programming analysis was done with the objective to minimize the number of pods in the CTU. This was done with the constraints that number of Telepaks should exceed 40 on average but not exceed 56 on a 98th percentile day for Telepak activity. There were also limits placed on the average number of calls a day at each pod, three pods were separated due to a higher proportion of critical calls, and each hospital unit must have all Telepaks in one pod. Historical data was used from the call log and Telepak inventory log to estimate these numbers. It was found that only 4 pods were needed in the CTU, with each of them averaging 40 Telepaks and 50 daily calls. The allocation of hospital units to pods was also determined. With the new pod layout 4 and measurements of CTU equipment and inventory requirements, it was found that only 384 square feet of space(in a 24x16 layout) were required for the CTU, as opposed to the current area of 3125 square feet. This gave UPMC Shadyside direction for how to relocated their CTU.
It was found that this increased workload may lead to excessive utilization for the workers. So, it was determined through this analysis that there would be a fifth worker in the CTU, a designated runner who is responsible for receiving all calls related to admissions, transfers and discharges, putting Telepaks on patients, and communicating all patient information to the technicians. The new runner responsibilities were outlined in a manual, and colored cards were created for the runner to clearly provide crucial information to the technician for logging. It was found that average call time per day in this new layout increases to 10 minutes an hour per technician and 18 for the runner, from the 4 minute average previously. All these labor changes also reduced CTU costs from $1.8 million a year to $1.1 million, and the required workforce decreased from about 36 to 23 full-time employees.
Finally, a plan was put in place to ensure that all CTU workers could receive arrhythmia and runner training while on the job. A 36 day work schedule was prepared that allows them to do this while also practicing with an increased workload. This was part of a larger 56-day plan that involves moving to the new CTU and taking observations on the effectiveness of the updated layout.
Spring 2024 Senior Design Expo

Spring 2024 Projects
Best Overall Senior Design Project in SSoE

Project Summary
The Lawrence Livermore National Laboratory is a federally funded research and development center that is collaborating with the Space Domain Awareness (SDA) Tools, Applications, and Processing (TAP) Lab as part of the second cohort of the TAP Lab’s Apollo Accelerator program. This technology accelerator program aims to solve the operational needs of the US Space Force and further space domain awareness capabilities. The RocketWatch team was assigned to create a tool to detect if a rocket launched from Earth to geosynchronous orbit (GEO) could be a threat to GEO satellites. The primary satellites of interest are the ten Wideband Global SATCOM satellites, which are the backbone of the U.S. military’s Wideband satellite communication capabilities. The team’s Python-based tool uses an ordinary differential equation to simulate a rocket’s trajectory based on given rocket inputs, such as mass, fuel consumption rate, and maximum thrust. Satellite location and velocity data is propagated through time to determine each satellite’s estimated future position at the time the rocket could potentially reach GEO orbit. Then, the rocket’s thrust profile is optimized to see if, given the rocket parameters, the minimum possible distance between the rocket and the satellite will be within two hundred kilometers. If so, a warning that the satellite is at risk of collision will be generated. The target users for this tool are US Space Force Guardians, who can then assess the threat and employ maneuvering techniques if necessary to keep the satellite safe from collision. This tool will fit into a wide catalog of applications that the SDA TAP lab develops through their collaborations with industry, the government, and academia.
Pictured
Project Summary
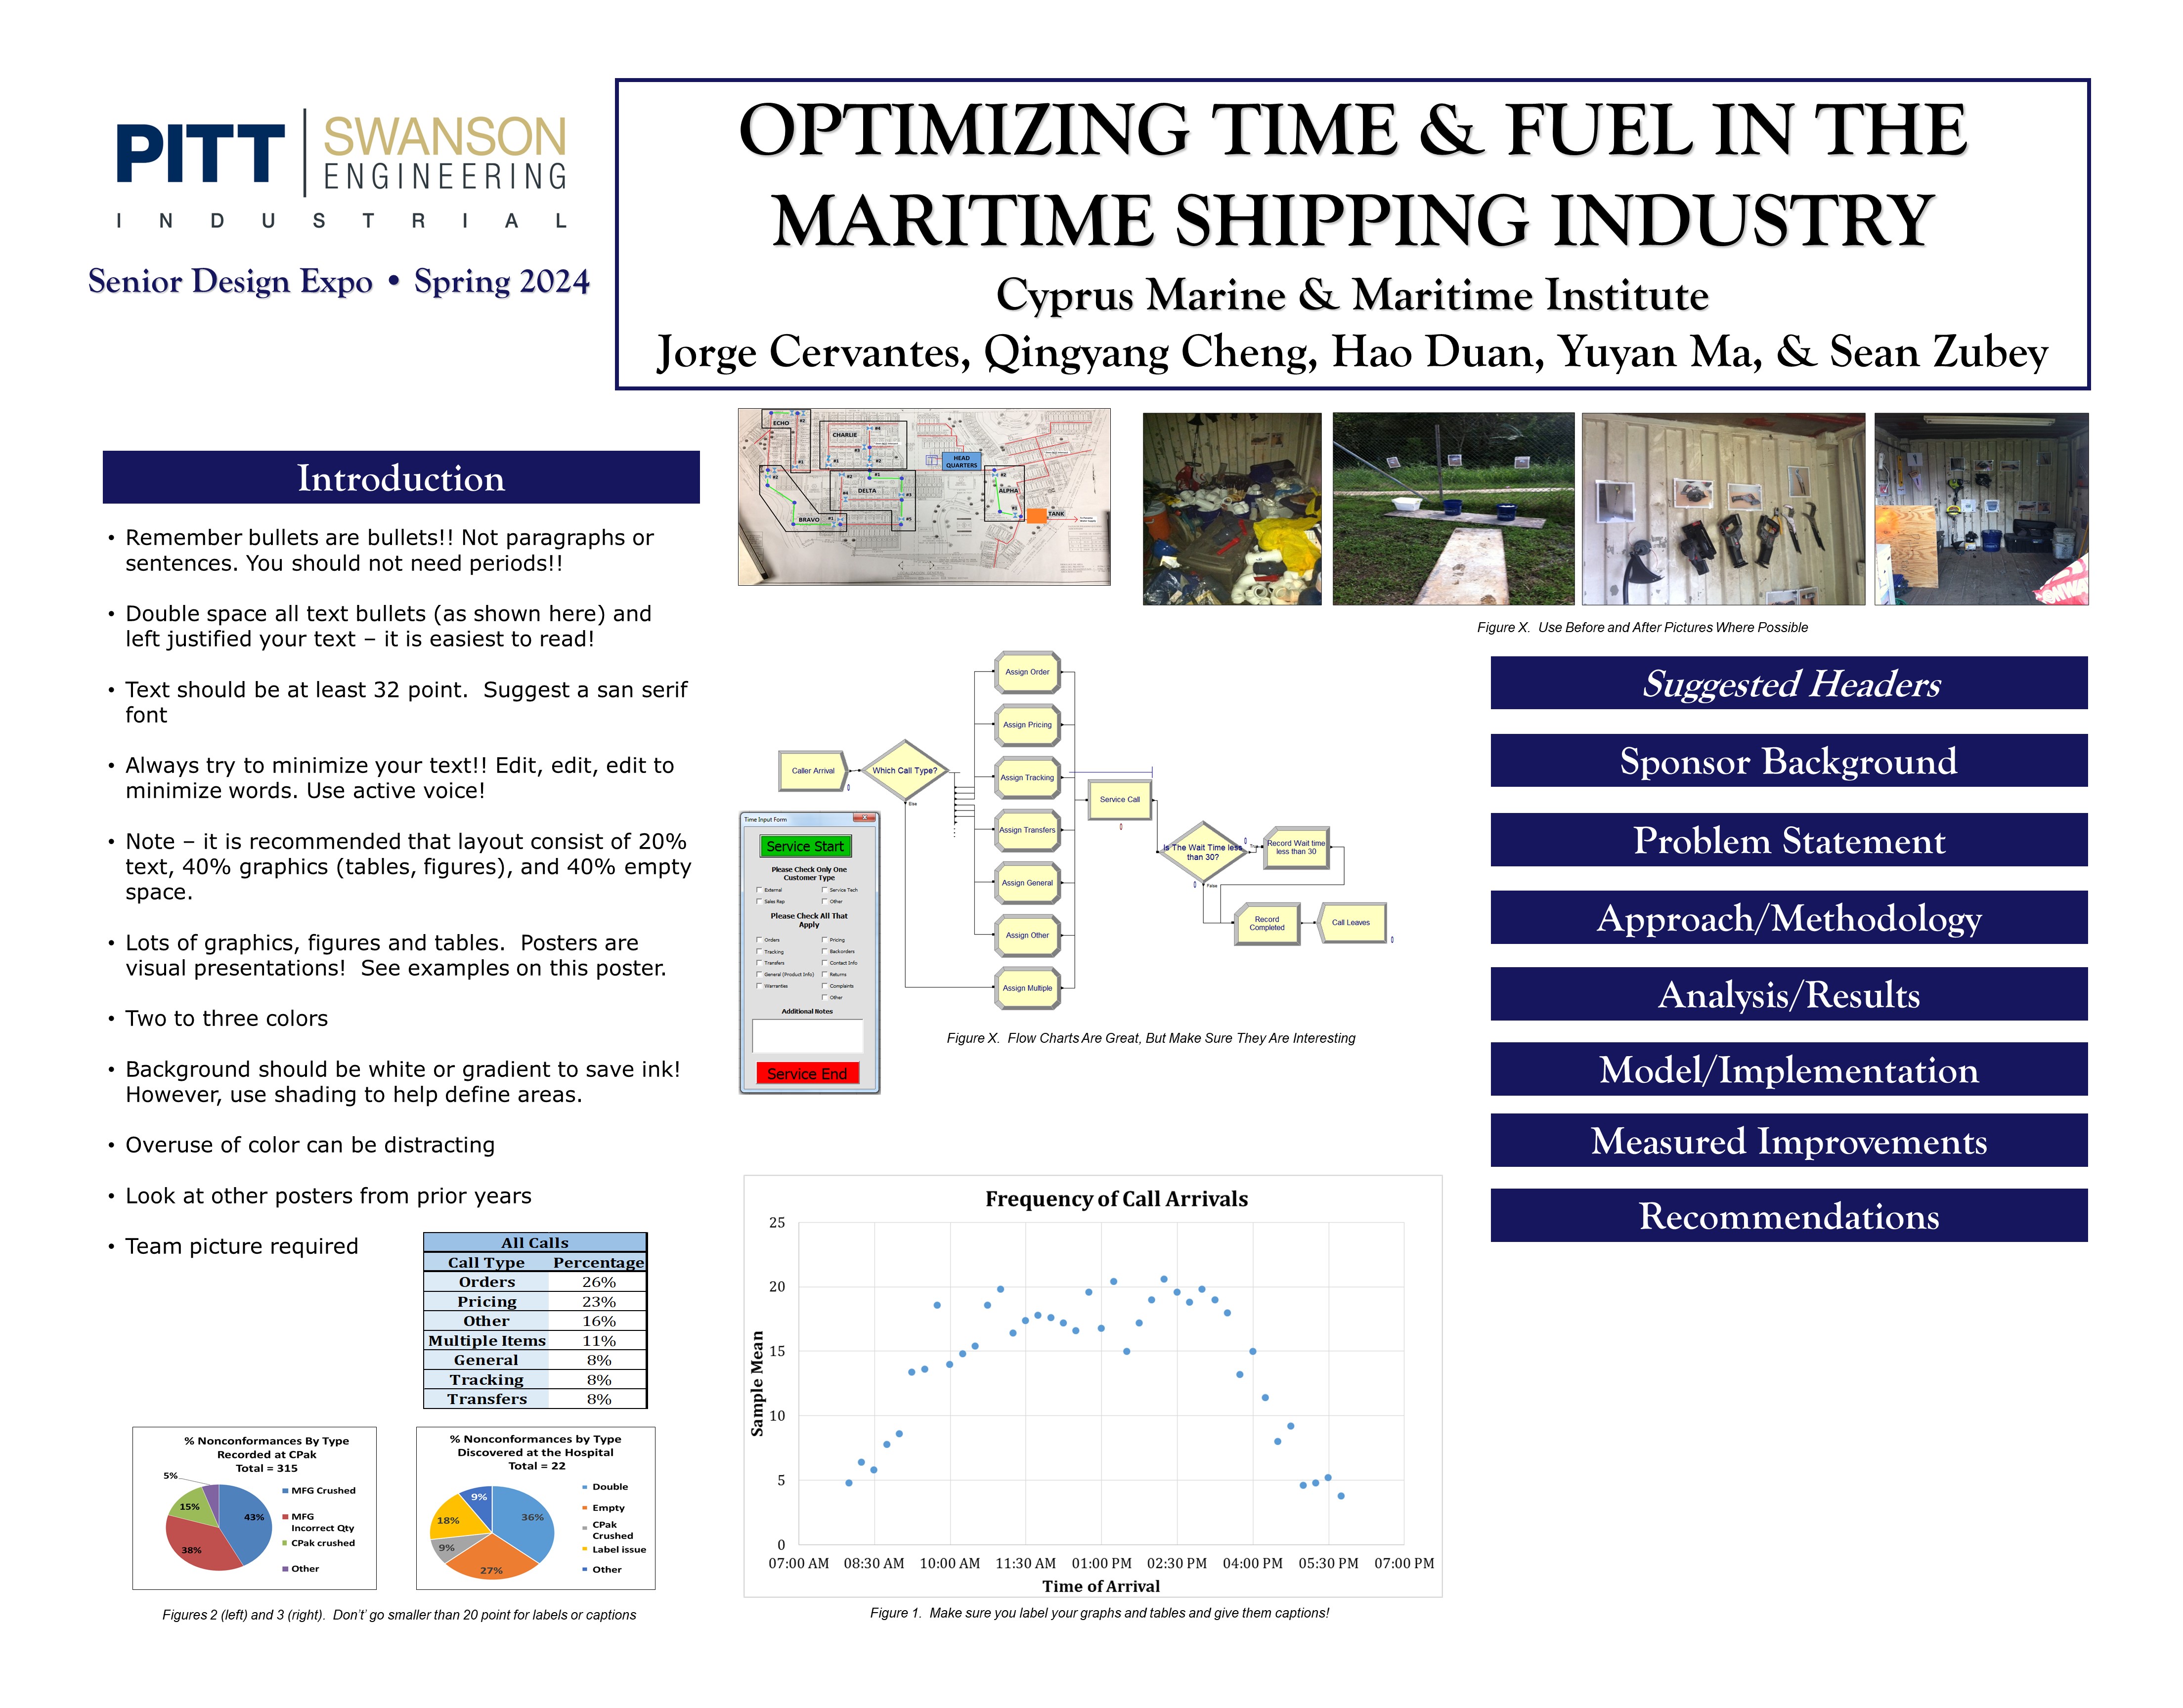
Our collaborative project with the Cyprus Marine & Maritime Institute (CMMI) addresses key challenges in the maritime shipping sector, particularly pertaining to port congestion and fuel usage. Leveraging real-time ship movement data sourced from the Automatic Information System (AIS), our focus lies in predictive analytics to optimize port congestion management. By enhancing the efficiency of vessel queuing and port operations, our initiative aims to concurrently diminish fuel consumption and reduce waiting durations for ship docking, thus fostering a more sustainable maritime environment.
Employing a multifaceted approach, our project integrates various data analysis techniques and classification models. Initial stages involved the development of port congestion indicators utilizing methodologies such as convex hull and geohash area calculations. Subsequently, we constructed a classification model utilizing these indicators alongside other pertinent ship data, enabling precise predictions of individual ship service times. Guided by these models, directions are offered to ships approaching port queues, presenting three distinct scenarios: direct port entry, deceleration towards port entry, or deceleration followed by into the anchorage area for waiting. These scenarios are designed to streamline port operations, thereby fostering efficiency. In essence, our project endeavors not only to decrease operational costs for ships but also to mitigate waiting times, fuel consumption, and emissions. These measures align with sustainability goals and contribute to mitigating negative environmental impacts. Furthermore, by facilitating smoother trade flows, our efforts contribute to the establishment of reliable supply chains, fostering punctual deliveries, increased customer satisfaction, and broader economic advantages across stakeholders within the maritime shipping industry.
Project Summary
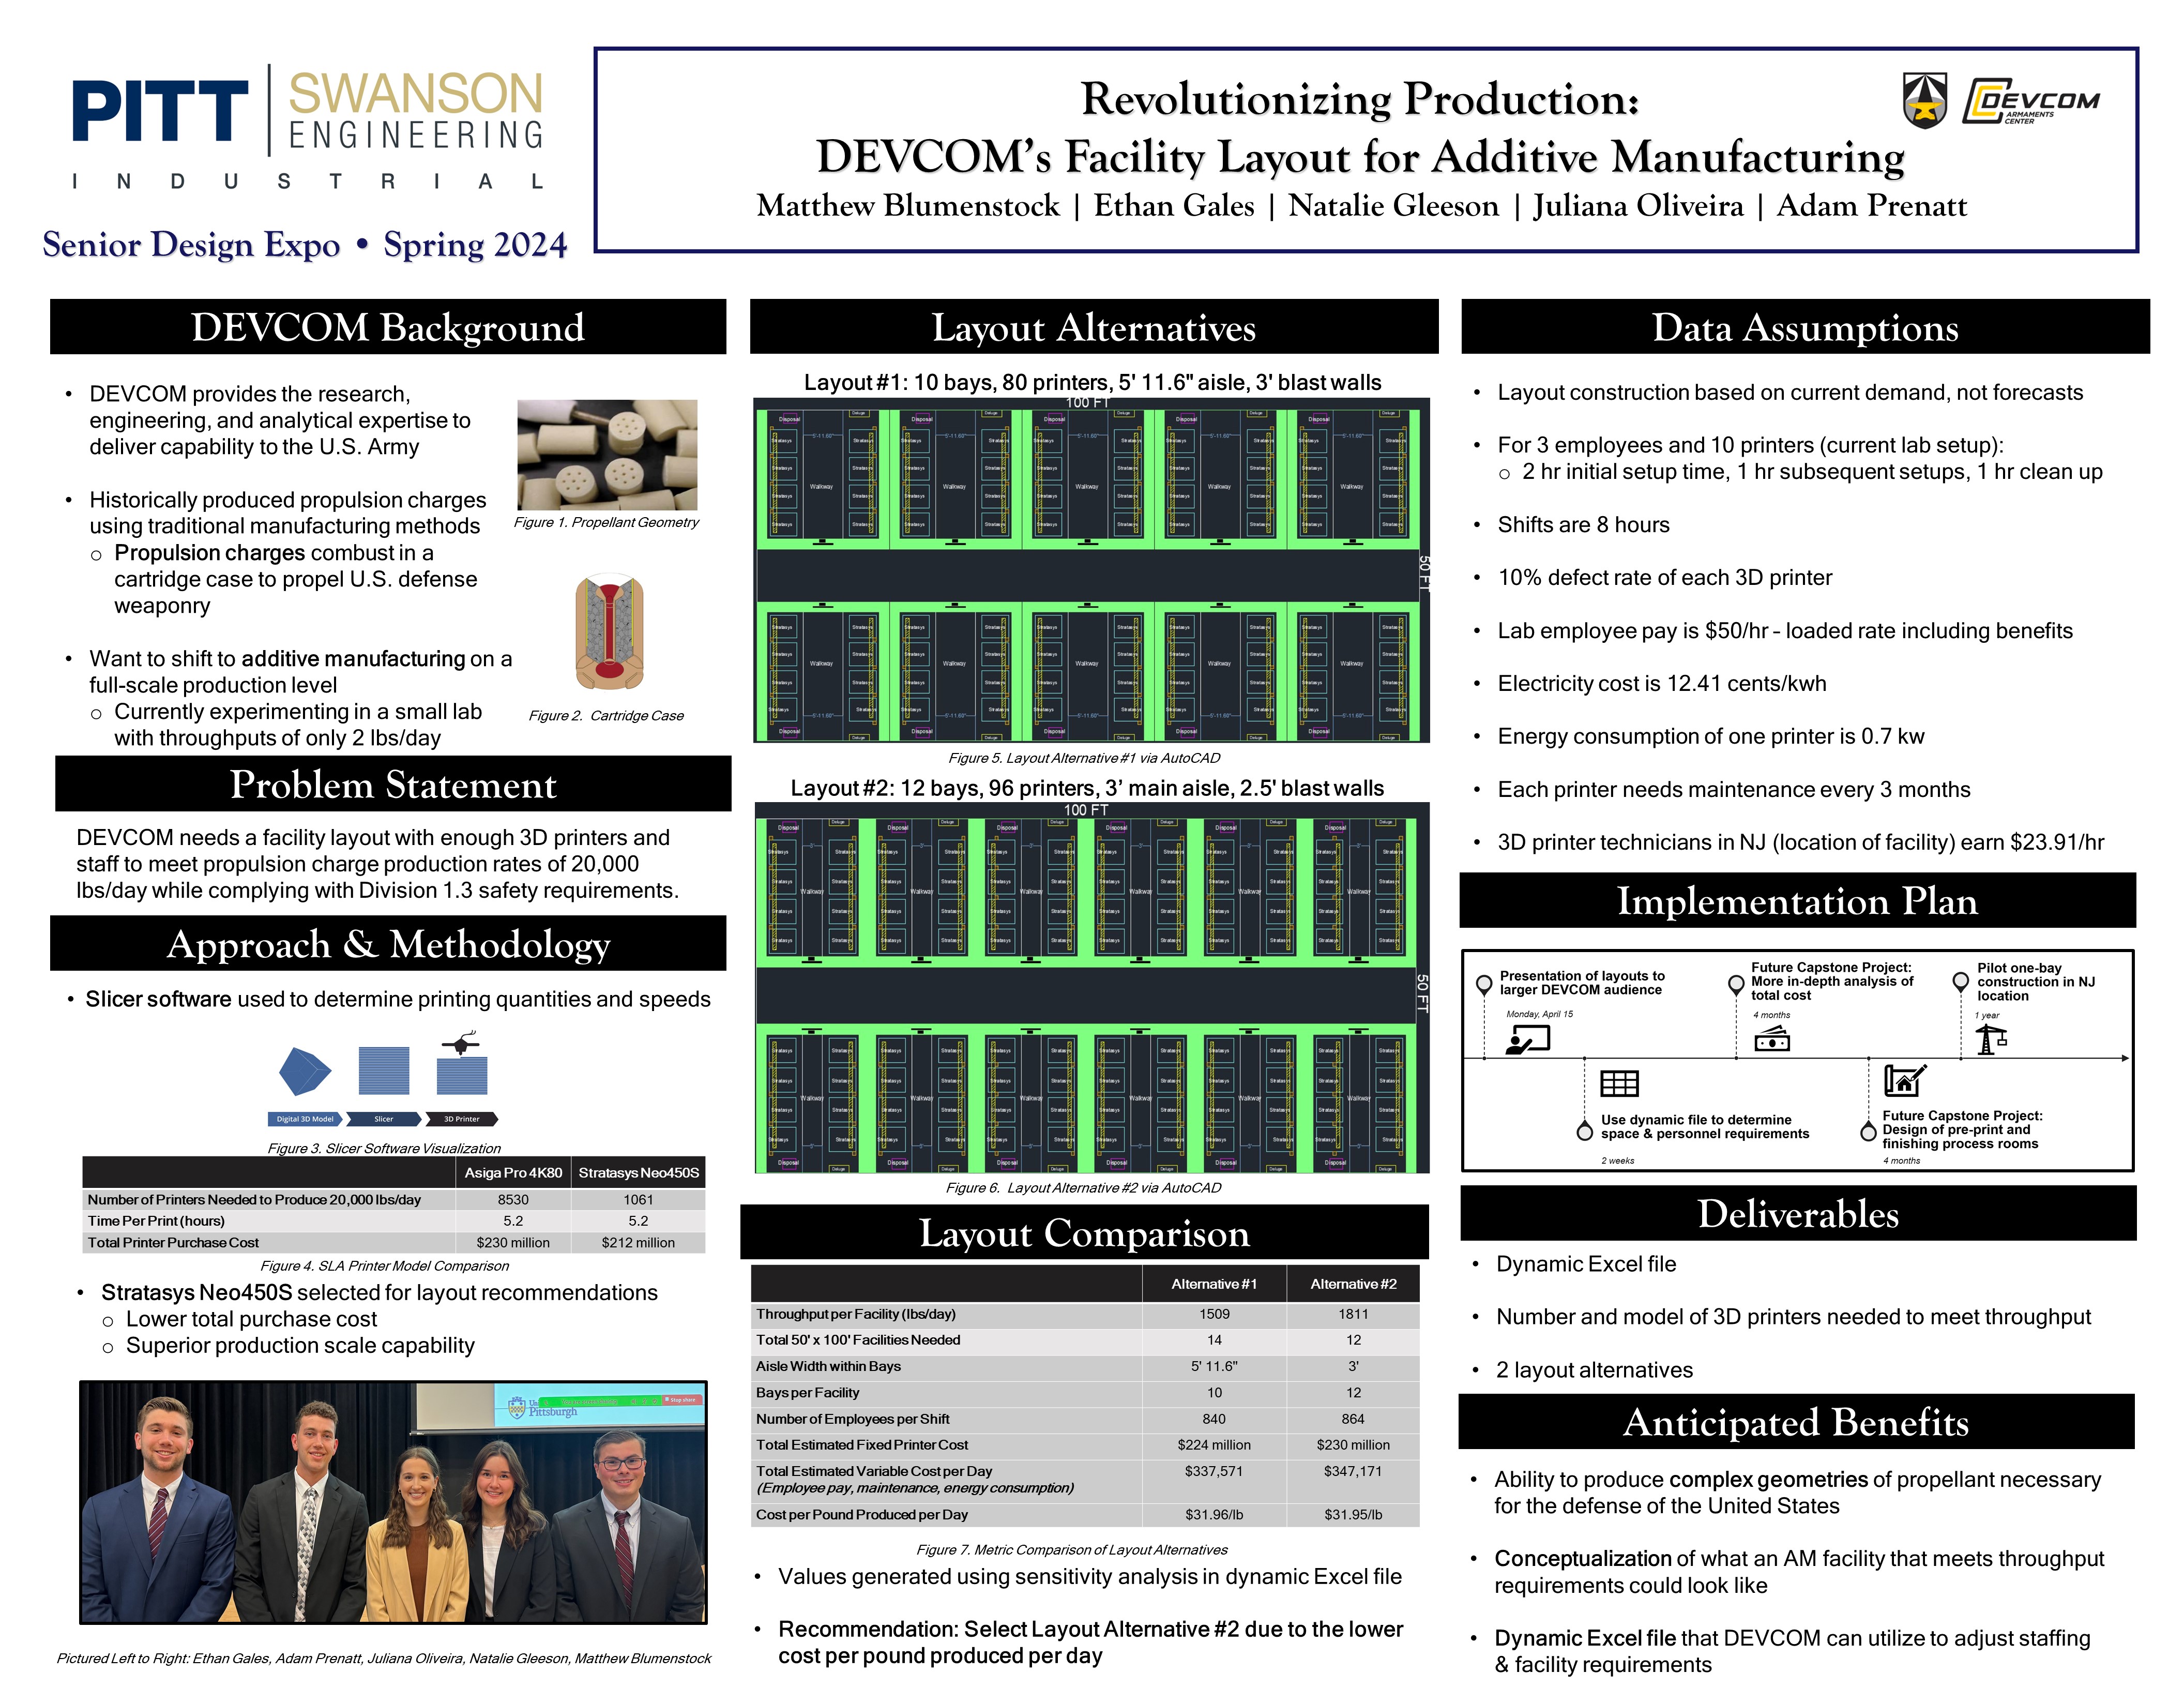
DEVCOM, the U.S. Army Combat Capabilities Development Command, provides the research, engineering, and analytical expertise to deliver capability that enables the Army to deter and defeat any adversary. Our team collaborated with DEVCOM’s Energetics, Warheads & Materials division as we worked to design an additive manufacturing (AM) layout that could manufacture propulsion charges. Propulsion charges combust in a cartridge to propel defense weaponry. These were historically manufactured using solvent-based traditional methods which are very time-consuming, complex, and involve many different types of machinery. Therefore, DEVCOM wants to move away from this and is currently manufacturing the product in a small-scale AM laboratory with a capacity of 2 pounds of product per day.
DEVCOM tasked us with creating a facility layout with enough 3D printers and staff to meet propulsion charge daily throughput of 20,000 pounds while complying with Division 1.3 safety requirements. Our team considered two different 3D printers and decided to utilize the Stratasys NEO450s due to its superior production scale capabilities and lower printer purchase cost. After selecting the Stratasys, we developed two different facility layouts in AutoCAD. These layouts consider DEVCOM’s safety requirements, production schedule, and desired production rates.
A dynamic Excel file was created to perform sensitivity analysis relative to the two proposed layout alternatives. The layouts were compared using fixed printer costs and variable labor, maintenance, and electricity costs. We recommend the layout that had the lowest cost per pound produced. Our project served as a way for DEVCOM to visualize what AM could look like so they can begin to accept it as a production method for propulsion charges. The primary future state benefit of AM is the ability to produce complex and precise geometries that could not otherwise be produced via traditional manufacturing.

Project Summary
DEVCOM Armaments is at the cutting edge of military research and development. Their continued support of the United States military includes the production of gun propellant. DEVCOM is currently beginning the process of transitioning propellant production from traditional manufacturing techniques to additive manufacturing. They are currently operating with additive manufacturing on an experimental lab-scale, and hope to expand to a fully functioning additive manufacturing facility in the future. During this project, the team worked with DEVCOM, the Advanced Robotics for Manufacturing (ARM) Institute, and the University of Pittsburgh Industrial Engineering faculty to meet the needs of the client and create solutions for a future DEVCOM additive manufacturing plant. The team developed a dynamic file for throughput calculations and size requirements of the facility, a high-level facility layout that meets DEVCOM’s desired daily throughput of 20,000 lbs, and a recommended implementation plan to incorporate automated material handling methods. The facility layout includes individual bays that contain multiple printers surrounded by cement blast walls to minimize the safety risks of manufacturing explosives. Our automation findings include the use of automated guided vehicles (AGVs) to transport printer build plates and a recommendation to collaborate with ARM to conduct research and development for automation of the printer vat refill process. These advancements and recommendations ensure that DEVCOM will remain at the forefront of armament technology for the US government, and the future transition of production can be smoothly made to both additive manufacturing and automated material handling.
3rd Place in Senior Design Expo
Project Summary
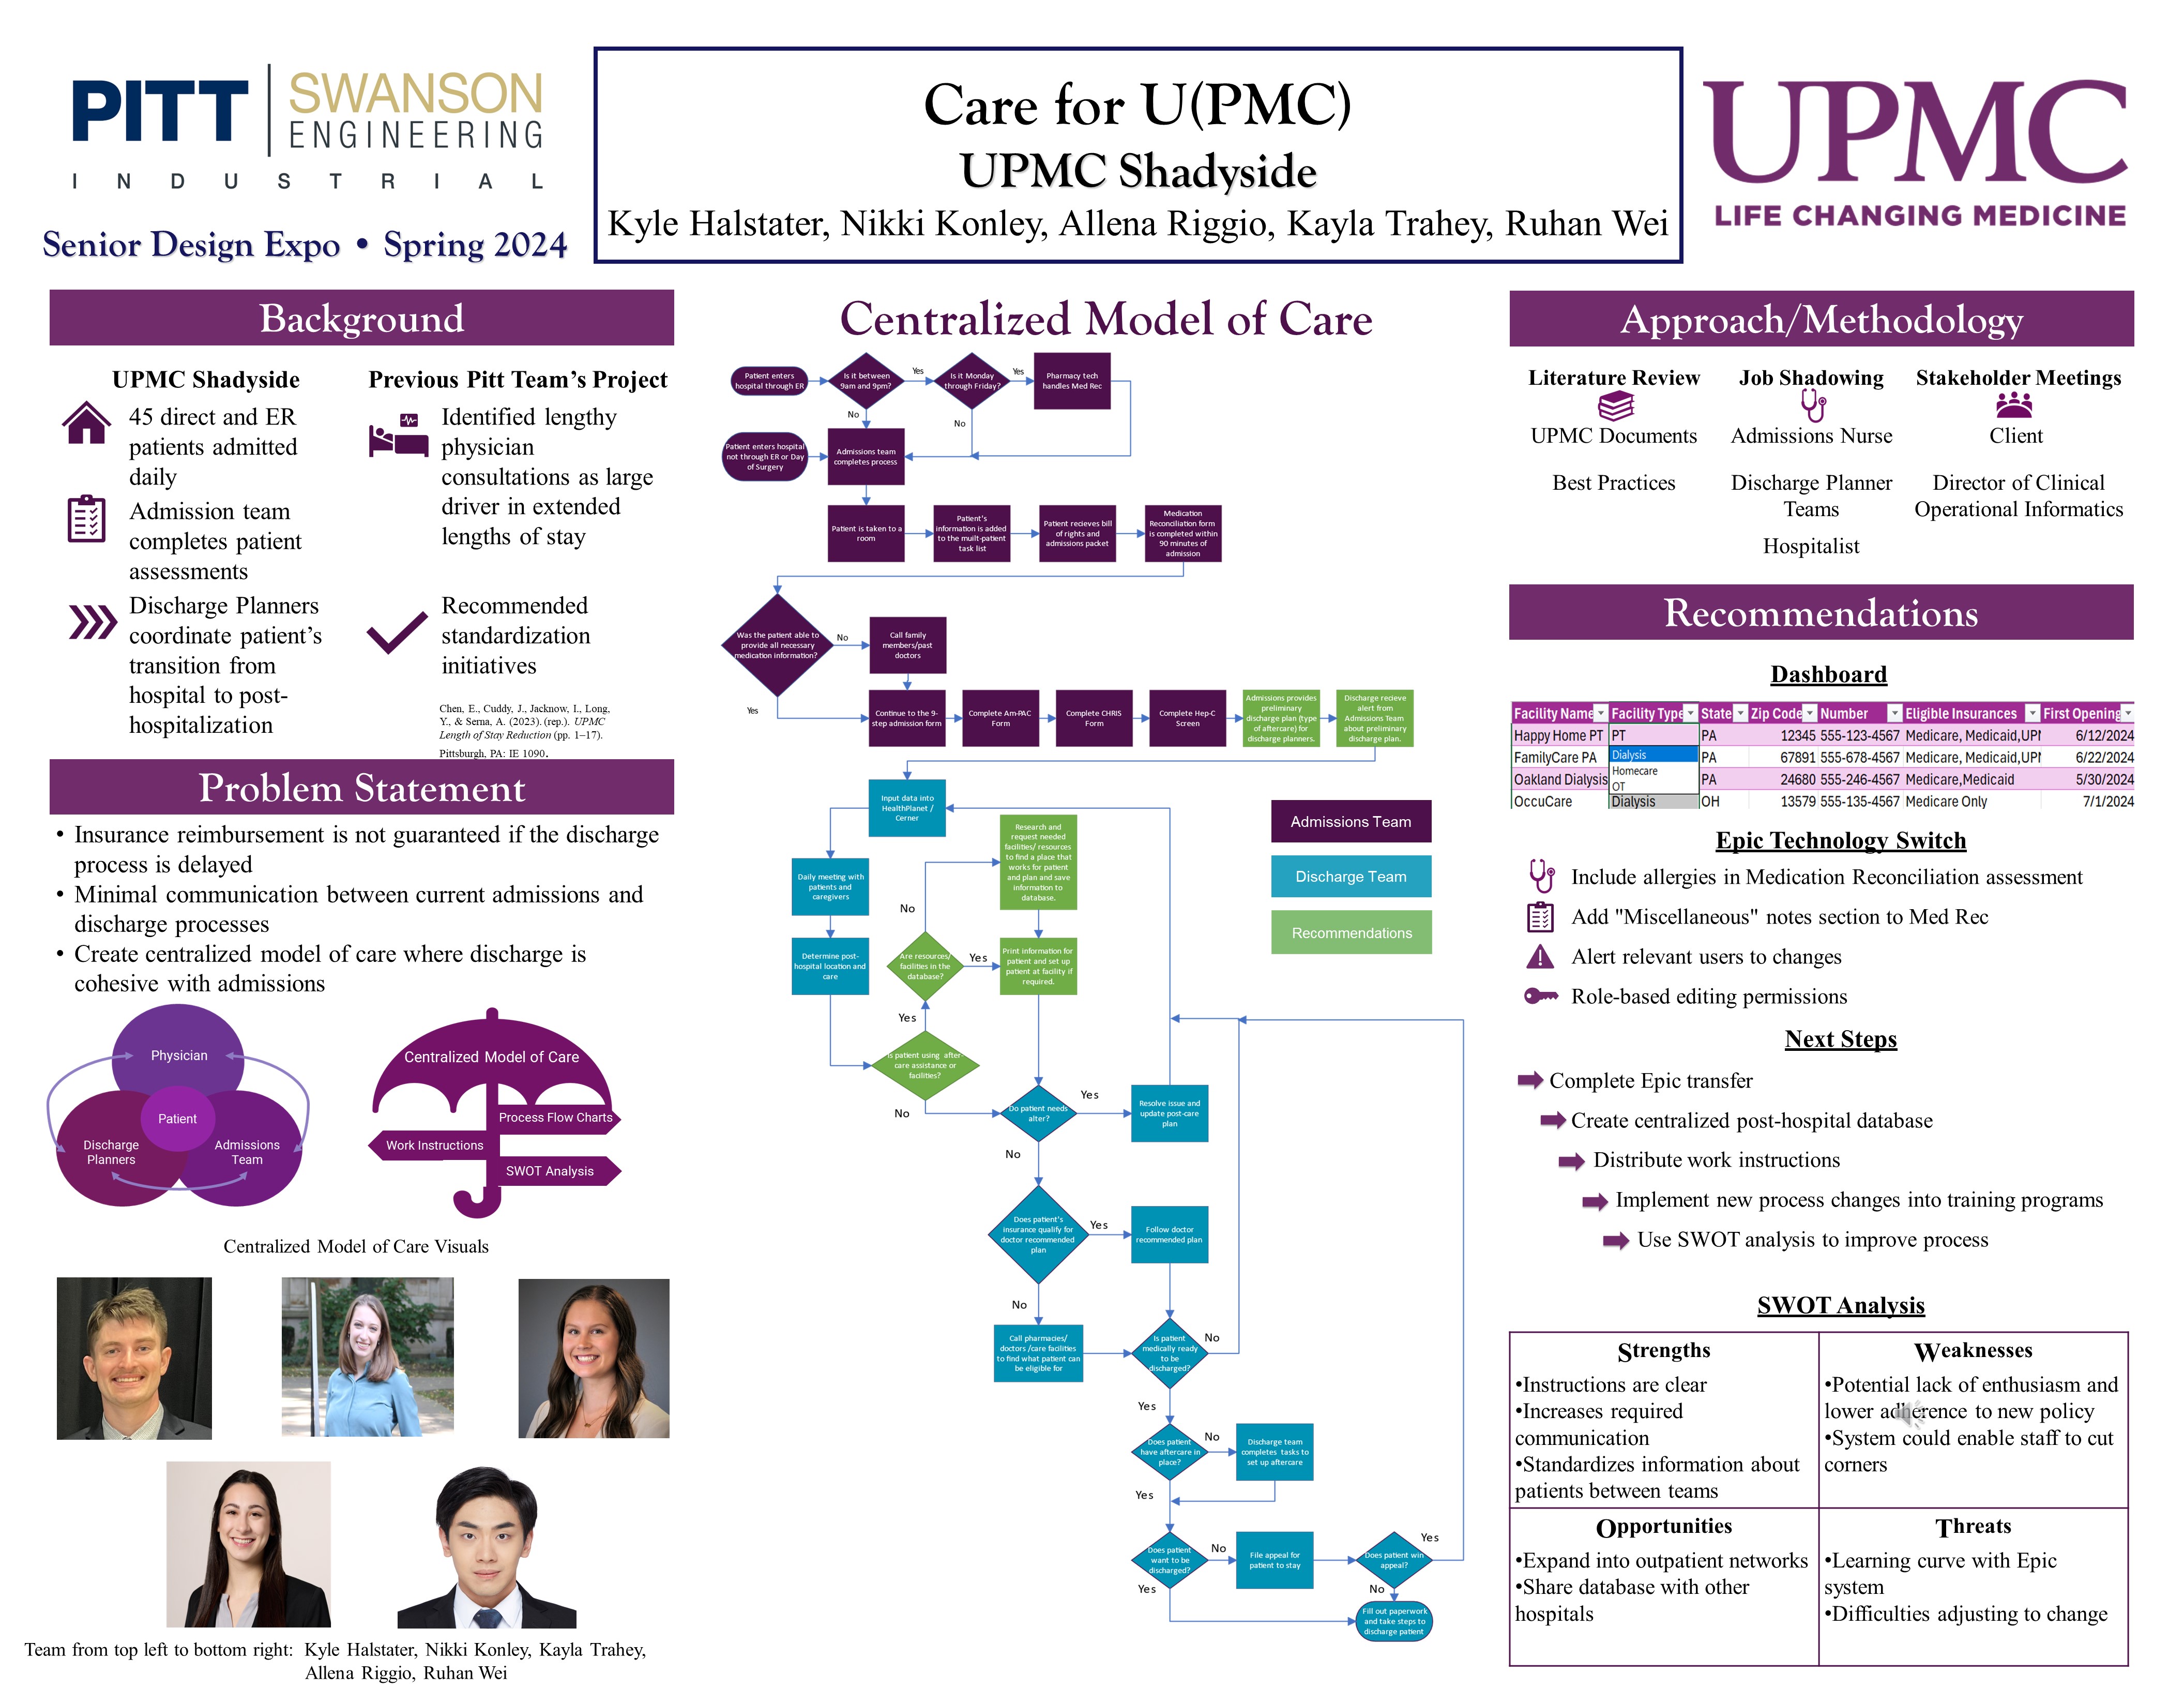
UPMC Shadyside admits approximately 45 patients daily. Every patient is seen by the admissions team at the start of their care, and the discharge team throughout their stay. Currently, there is limited communication between admissions and discharge employees. This can result in patients being discharged late, causing financial burden to the patient and hospital. Additionally, UPMC currently uses Cerner as their information system, but will be switching to Epic in 2025. Because of this change, UPMC wants to seize this opportunity to evaluate their current processes and implement a centralized model of care to ensure efficient communication between admissions and discharge.
The team conducted a review of healthcare literature and UPMC’s existing protocol documentation to understand the responsibilities performed by each team. The team also conducted interviews with various stakeholders, including an admissions nurse, discharge planners, a hospitalist, a patient, an Epic representative, and the client. After mapping the current state and adding recommendations, we received feedback on our initial findings. From there, we implemented improvement recommendations and developed the centralized model of care.
Proposed process improvements include reviewing patient allergies at admissions, identifying a preliminary discharge plan, and creating a database for post-care patient facilities. Technology improvements include adding a miscellaneous note section to increase visibility of patient condition, alerts for changes, and role-based editing permissions.
Upon the completion of the model of care, we conducted a SWOT analysis and sought out client feedback on the process. We expect the benefits of these changes to enable better communication of patient information between admissions and discharge, facilitate more efficient decision making, reduce the discharge process time, and make regularly needed information more accessible.
Project Summary
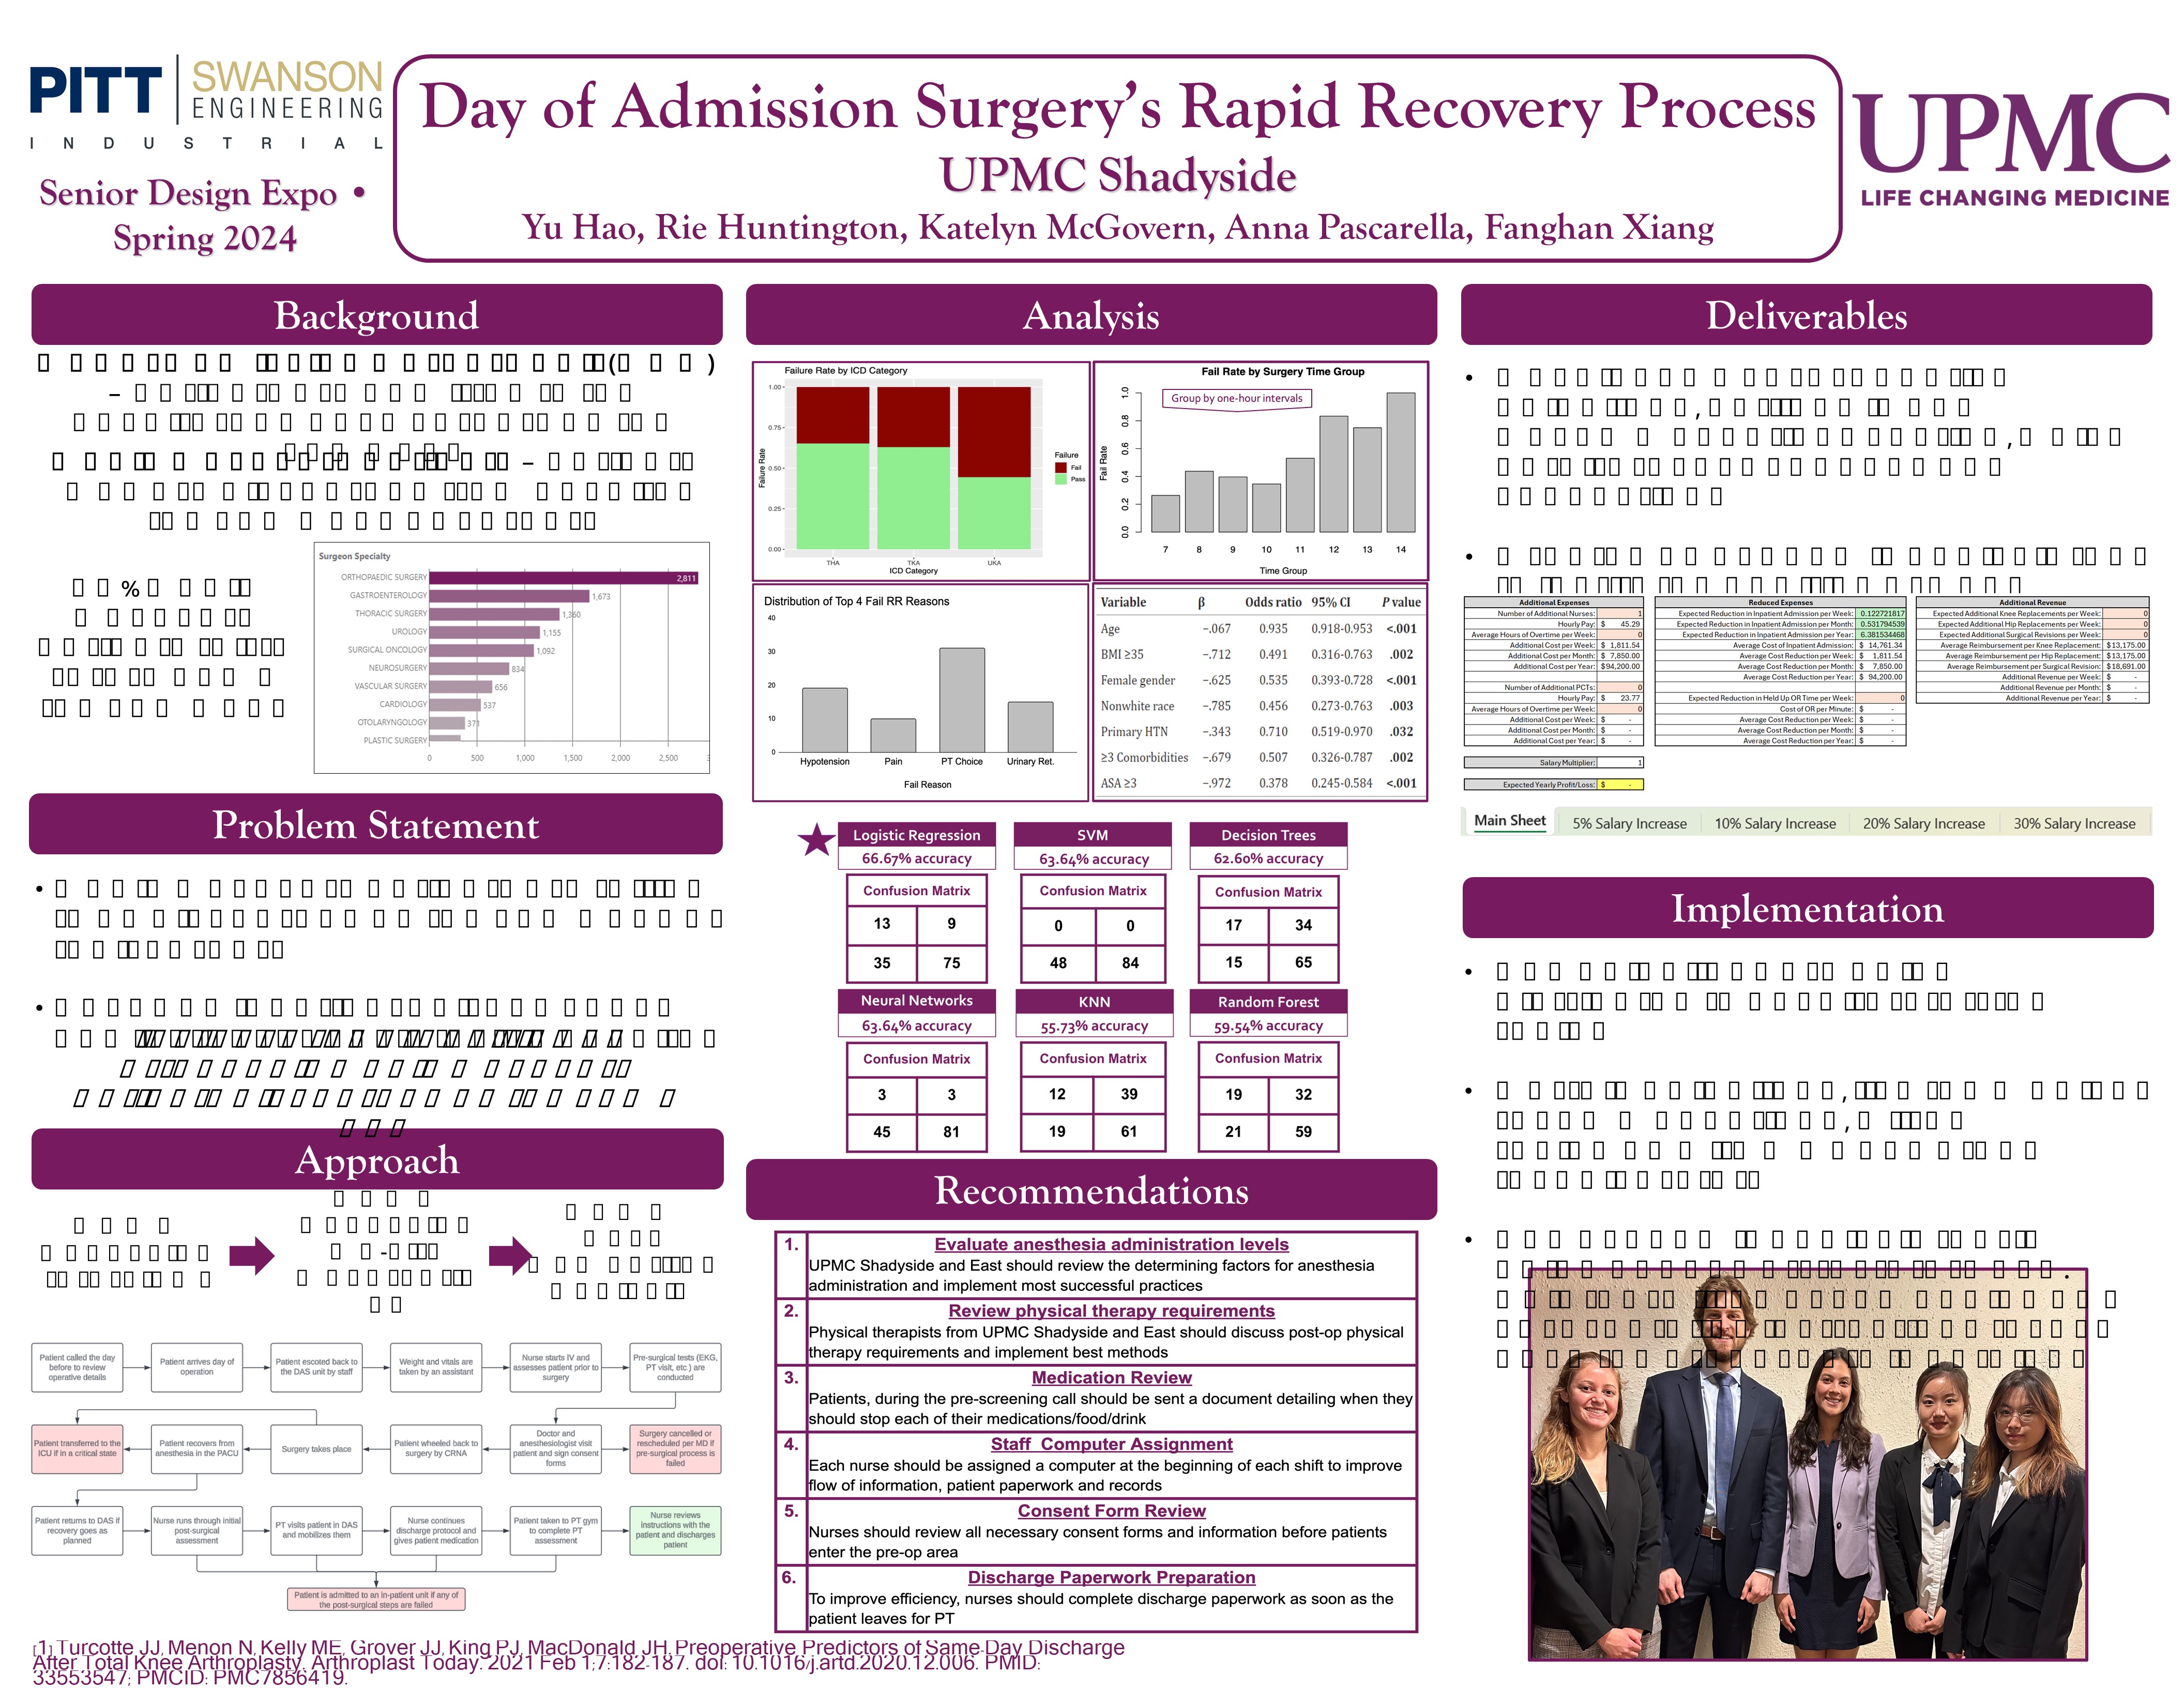
The Day of Admission Surgery Unit at UPMC Shadyside is a surgical unit which admits patients and conducts surgery on the same day. Rapid Recovery patients are patients who are discharged as well on the same day as their procedure. Of orthopedic DAS patients at Shadyside, which the team focused on for this project, 35% of Rapid Recovery patients fail to be discharged on the same day. The team aimed to develop strategies to decrease this proportion and help more patients return home on the same day.
To better understand the current state, the team conducted interviews, shadowed at Shadyside, and conducted data analysis on patient data from the past year. With this data, the team developed six machine learning models classify patients as good or bad candidates for Rapid Recovery based on their demographic and intrapersonal characteristics. The trends found in constructing these models, along with findings from a literature review conducted by the team, served as the basis for the development of patient selection guidelines for the program.
Using the qualitative findings from data collection, the team created a set of adaptive guidelines to correct process shortcomings and guide best practices moving forward. These recommendations include reviews of anesthesiology and physical therapy processes, paperwork streamling on multiple fronts, and a medication review among others. The team also developed, using figures received from Dr. Adolph Yates, an economic analysis tool to justify staffing increases in the unit, which the team found would increase system capacity and throughput through various forms of analysis.
Project Summary
Introduction
PPC Pitbulls is a digital marketing company that specializes in e-commerce marketing. The company utilizes the power of Google, YouTube, and Meta for ad management, while also placing a strong emphasis on email marketing and data analytics. The company primarily utilizes LinkedIn to draw in clients with content posts that would attract a client searching for a way to market their company more effectively that can be done through PPC Pitbulls services.
Problem Statement
There is too much time and money spent on the content creation process deemed inefficient by PPC Pitbulls. There is a lack of structure which decreases the number of potential clients to interact with.
Tasks Explained
The daily content creation process of LinkedIn posts is what the team was tasked with improving. This process is defined by a certain type of post getting put on LinkedIn from every day from Tuesday-Friday. Each post describes a different subject about the company itself or the marketing industry. The team improved the efficiency of creating these posts, allowing PPC Pitbulls employees to have more time in their schedules for other activities.
Results, Recommendations, and Conclusions
The results were obtained through lean processes and root cause analysis, along with data crawling utilizing Google API. Tools such as fishbone diagrams and the 5 Whys were used. The team recommends implementing a standardized content creation process utilizing AI, including ChatGPT for initial drafts and content categorization. Also, enhancing promotional strategies by using data analytics to identify peak engagement times and trending topics for content focus and continuous monthly review cycles with room for adjustments based on analytics. Final conclusions suggest that this new content schedule can improve the efficiency of PPC Pitbulls content creation process if implemented.
Project Summary
FedEx Ground is a package delivery company covering 220 countries and territories with more than 2000 operating facilities across the world. Currently, their operating facilities use barcodes to track and move packages throughout the network which require manual scanning. Physically touching every package, as one facility handles tens of thousands every day, consumes a lot of time. The current process is not at peak efficiency. In order to improve the system used now, we recommend FedEx to implement radio frequency identification (RFID) technology, which is a wireless technology using a tag and receiver to “scan” each package. RFID does not require physical touch and can scan multiple packages at once.
In order to accurately support our recommendation for FedEx to replace their current system at the North Pitt facility with RFID, we researched RFID technology, pros and cons to the system, and conducted a market analysis with companies who already implemented RFID. Furthermore, we conducted a quantitative throughput comparison and processing time analysis. From the results, we confidently concluded it would be in the best interest of FedEx Ground to implement RFID into their operating facilities. We created models from our cost analysis and payback period estimation that can be used at each facility. Lastly, we will offer an RFID placement plan that includes which RFID product to use, where to place it, and key performance metrics to track ongoing measurements post-implementation. By leveraging these tools and insights, FedEx Ground facilities can make informed decisions, measure costs, and track improvements in operational efficiency and performance, ensuring long-term success and competitiveness in their respective markets.

Project Summary
To address maintenance inefficiencies in dieset at Kennametal Inc., a top metalworking company, this project sought to improve the lifespan estimation of dieset parts using detailed statistical analysis. Traditionally, operators estimated maintenance times based on their experience and inspect in every 5000 pieces, which led to variability and more scrapped products, affecting profits.
We conducted a comprehensive data analysis on production records from 20 pressing machines, focusing on the number of units produced between required maintenance for top and bottom punches. Employing statistical methods such as Mean and Median, Histogram and Goodness-of-Fit Tests, we successfully quantified the lifespan of top and bottom punches. Additionally, we utilized Fourier Transform Analysis to investigate the periodicity of scrap production, which directly influences maintenance timing.
The analysis revealed distinct lifespans for different dieset components, with top punches lasting an average of 20,342.8 cycles and bottom punches 22,579.3 cycles before degradation impacts production quality. Our findings led to a significant revision of the maintenance schedule, recommending inspections at every 12,048 units produced. This schedule adjustment was based on a failure probability analysis, which showed a failure probability of 27.67% for top punches and 20.10% for bottom punches at this interval.
Project Summary
Our team, consisting of IE students from the University of Pittsburgh, partnered with Alstom, a global leader in rail transport and engineering, to address inefficiencies in the electrical and mechanical subassembly process at the West Mifflin, Pennsylvania facility. The focus of our project was to improve workflow and space utilization in the subassembly department, which constructs critical components for airport rail systems.
The challenges identified included inadequate space allocation, inefficient materials, and information flow, and frequent misidentification of work-in-process (WIP) as finished goods. These issues contributed to reduced productivity. Our methodology integrated lean Six Sigma and the 5S methodology, emphasizing continuous improvement and more effective layout of subassembly.
Employing Systematic Layout Planning (SLP), our methodology centered around three aspects: space requirements analysis, activity relationship mapping, and process improvement based on the 5S framework. We assessed the physical space to ensure adequacy for the tasks and implemented an Affinity Analysis Diagram to evaluate the proximity needs between different departments. The Miami assembly department, for instance, was identified with a "U" relationship (Unnecessary) to other departments, suggesting no need for proximity, which guided the redesign of the layout to reduce unnecessary interactions and enhance efficiency.
Significant enhancements were proposed through targeted 5S improvements, derived from direct observations and meticulous notetaking during facility visits. These improvements focused on implementing and optimizing visual management tools to aid in the identification and status tracking of subassemblies, thereby reducing errors and improving communication across teams.
Preliminary results demonstrated a potential for a 49% improvement in layout efficiency and a significant reduction in the distance between key workstations. (Reduced by 57.48%, 28.19%, 45.35% respectively.)
This project not only aims to enhance operational efficiency at Alstom but also serves as a model for integrating systematic layout planning and lean management in complex manufacturing environments.

Project Summary
IDL is a subsidiary of Matthews International located in Butler, JSON PA, where the printing house serves printing commercials for the big retail businesses. They have issues with the usage of the press most of the time incurring costs together with operational effectiveness. This project aimed to evaluate and improve IDL's three large-format digital presses, focusing mainly on the 2500, since it has the lowest average utilization.
On the other hand, the historical data emphasized the pressing need to increase the adjusted utilization from 47% to a target of 50% in the short term and 57% in the long term, at the same time aiming for the extension of actual operational hours by 850. This method involved a mixture of Lean Six Sigma and actual observations that helped in the identification and mitigation of activities that add no value and inefficiencies in the pressing process.
Some of the interventions conducted included the application of the Single Minute Exchange of Dies (SMED) technique in the area to reduce setup times and the suggestion of a restructured warehouse layout to optimize the handling of materials. The project also aimed at standardizing the operational procedures by the shifts in order to realize uniformity and efficiency. Preliminary quick-win improvements, which produced immediate positive impacts, set the stage for more extensive process modifications. The included matrix covered in detail, showing impact versus difficulty; it will help guide future enhancements: the redesigned process of reloading the presses and strategic recommendations on changes in the layout of the warehouse.
The expected outcome from such interventions is raised press utilization, reduction of operational costs, and a general boost to the production efficiency levels. This means that in the process, this IDL project will add to the current thrust of the IDL that operations are facilitated with significantly higher productivity without any further capital investment in new printing equipment, which is meant to enhance customer satisfaction.
Project Summary
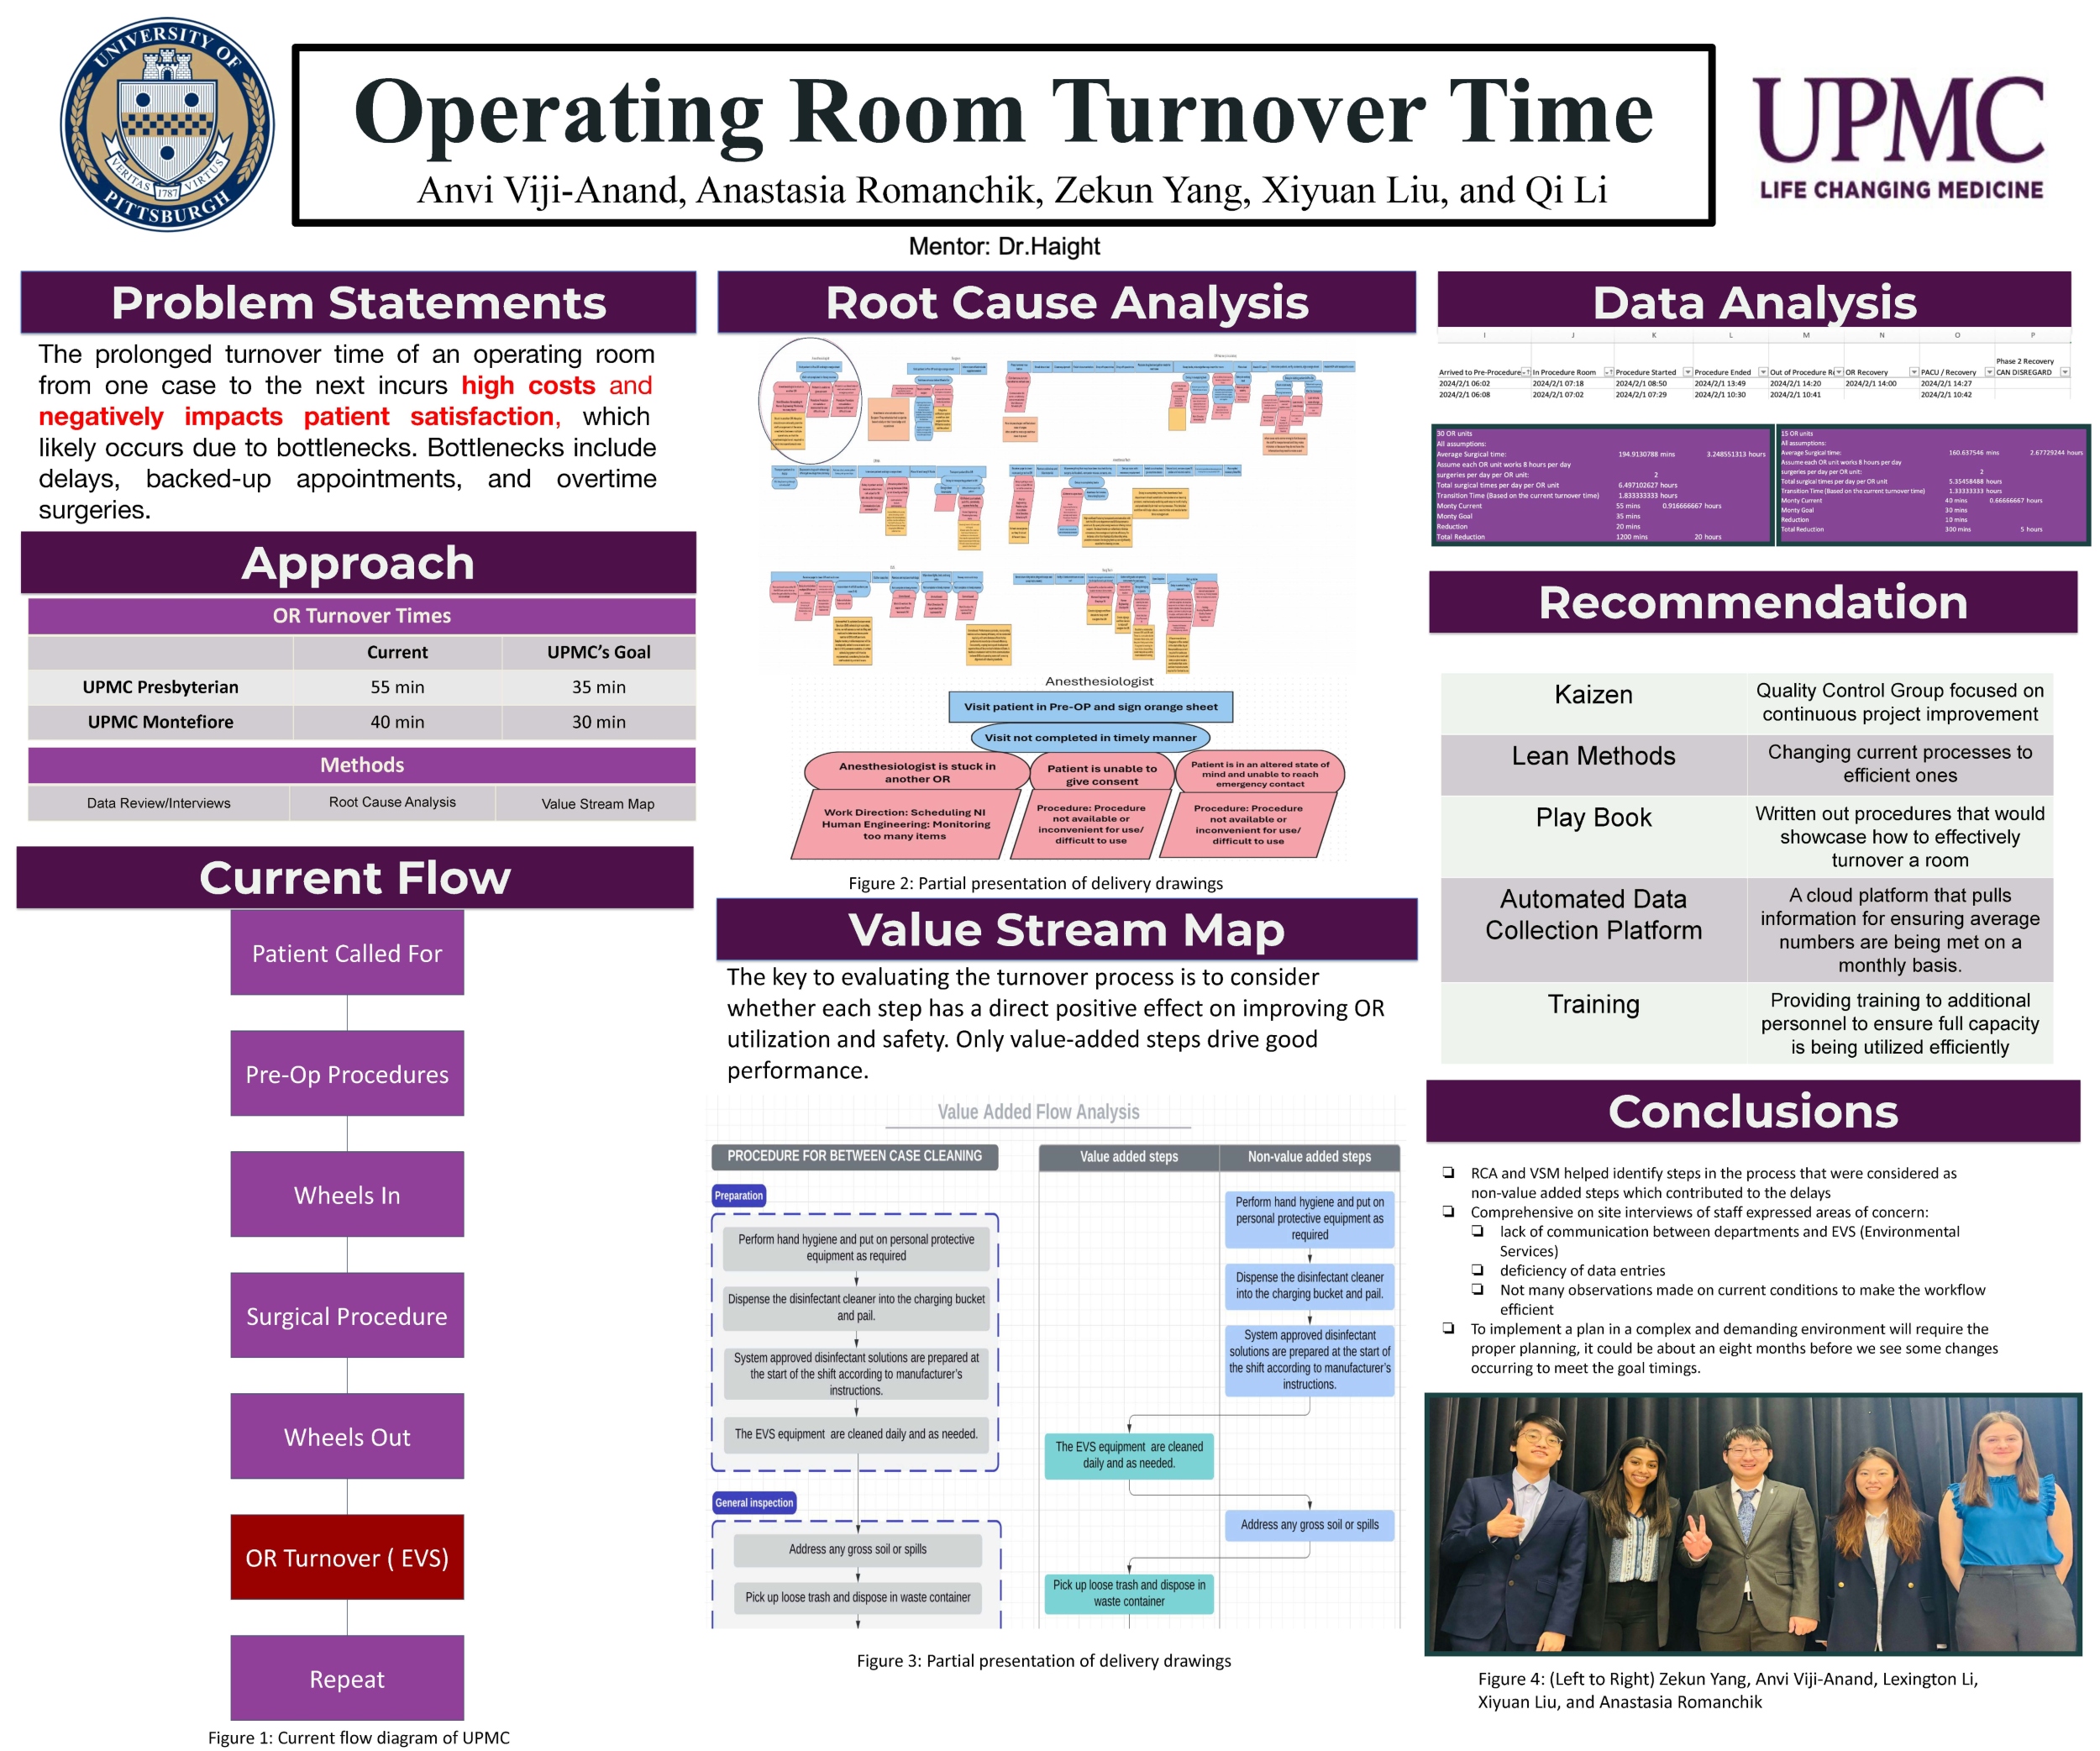
Our project this semester was to help UPMC find ways to reduce the average amount of time it takes to turn over an operating room. A turnover is the transition period from one surgery (cleaning up the room) to the preparation for the next surgery done by EVS (Environmental Service is responsible for the bulk of the turnover process). In 2023, UPMC Presbyterian completed 18,116 surgeries and UPMC Montefiore completed 5,081 surgeries. A turnover occurs between every surgery, and it costs $100/minute to turn over a room. UPMC Presbyterian’s average turnover time is 55 minutes and UPMC Montefiore’s average is 40 minutes. The UPMC’s goal is to reach the following timings: Presbyterian at 35 mins and Montefiore at 30 mins. We approached/analyzed the problem by conducting a Root Cause Analysis and Value Stream Map.
The first method we used is a root cause analysis which is a problem-solving method that identifies and addresses the root causes of underlying issues found. We conducted a root cause analysis for each department involved in the process to find where underlying issues occurred and offered UPMC recommended solutions. The second method we used was a value stream map that outlines current state operations identifying key performance measures in processes. In the Value Stream Map, based on their current turnover process, we identified value added and non-value-added steps. This helped guide us in understanding where potential delays occurred during the transition periods.
A few solutions we recommended at UPMC were the following: improving teamwork in the OR, communication/scheduling recommendations, implementing kaizens, and training to employees in case of EVS call outs.Implementing a plan in a complex and demanding environment will require proper planning, so it will be some time before we see some results to meet the goal timings.
Fall 2023 Senior Design Expo
Fall 2023 Projects

Project Summary
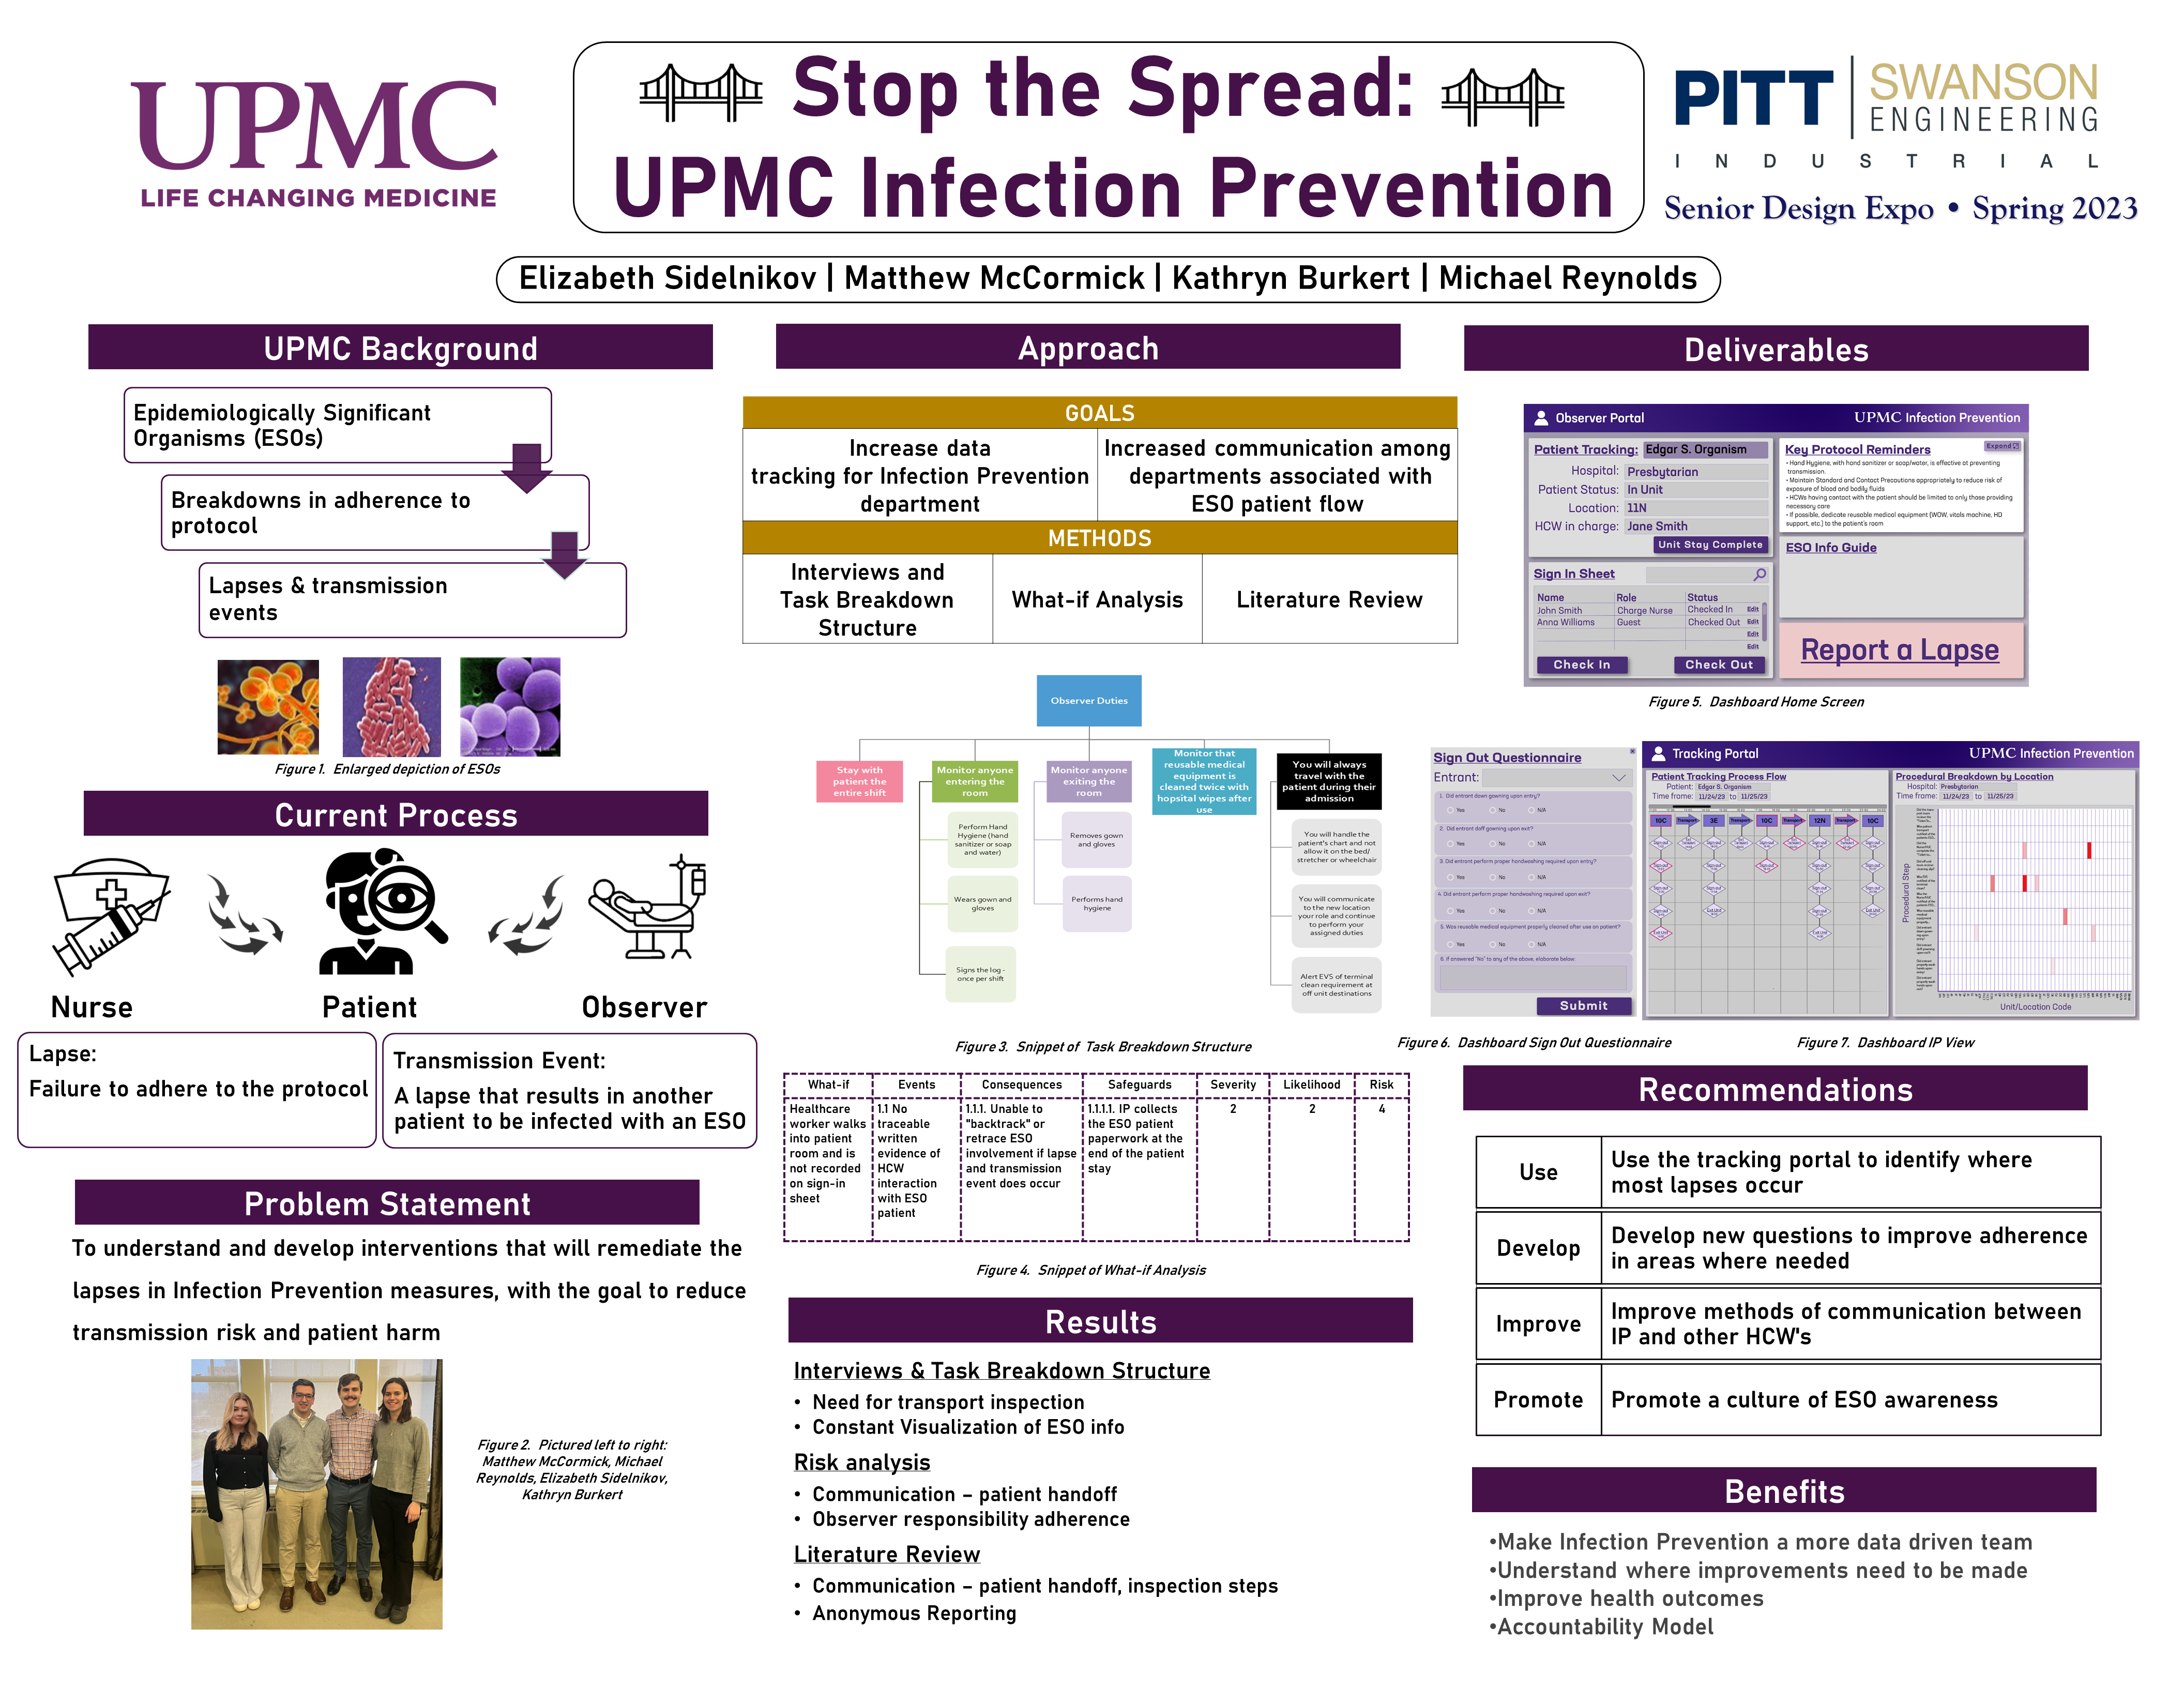
The Infection Prevention (IP) team at UPMC monitors patients with Epidemiologically Significant Organisms (ESOs). These rare but potentially life threatening organisms pose significant risks to patients and the hospital system. The IP team has developed a protocol for the care of ESO patients, involving nursing staff, observers, and housekeeping. The current IP protocol is insufficient and breakdowns occur that cause unnecessary patient exposure. Each lapse represents unacceptable levels of transmission risk that impacts patient safety. This is costly to UPMC in time, staffing, equipment, and testing, even if a transmission event does not occur. We would like to understand and develop interventions that better document these lapses with the goal to reduce transmission and patient harm.
The team conducted a review of healthcare literature and UPMC’s existing protocol documentation, creating a task breakdown structure using the latter. The team also conducted interviews with various stakeholders, including observers, nurses, patient care technicians, and IP team members. A What-if analysis was conducted to assess the risk associated with each responsibility in the protocol, revealing areas with the highest risk of lapses. These methods highlighted a breakdown in communication among hospital staff roles, particularly during patient handoff and transport. The solution to this problem was the creation of a dashboard with two views, one for the observer to virtually inspect the protocol and one for the IP team to track patient progress and observer documentation within the ESO patient care protocol. The dashboard’s main benefit is the creation of a data collection tool to better understand where lapses occur. Our team recommends using the dashboard to identify where lapses occur and to develop new questions to improve adherence where needed. The use of this dashboard will help to foster a sense of shared decision making to promote a culture of ESO awareness.
Project Summary
UPMC Shadyside is a 520-bed tertiary care hospital in Pittsburgh, Pennsylvania. The hospital’s centralized telemetry unit (CTU) monitors and distributes telepacks. Telepacks are attached to patients to detect abnormal heart activity. Despite having more than enough of these devices to meet demand, the CTU routinely runs low on inventory, leading to subsequent delays in telepack delivery. This project focused on identifying why this issue was occurring and recommending corrective actions.
The team conducted a root cause analysis and corresponding data analysis to quantify the current condition of CTU inventory. The CTU’s physical inventory system was determined to be difficult for staff to maintain due to a reliance on paper slips. Additionally, the CTU’s virtual inventory system was developed with inaccurate assumptions and as a result, did not reflect real inventory levels. Finally, a lack of standardization regarding inventory replenishment was identified. These deficiencies corresponded to an annual cost exceeding $5000 in unproductive labor.
Recommendations for the CTU focused on inventory system modifications and staff process changes. For the physical system, the use of paper slips for inventory was eliminated and a change to how telepacks are stored was suggested. For the virtual system, additional telepack statuses were developed to promote accurate device tracking and automated messaging was recommended to reduce device return times. Finally, routine telepack collection times and an inventory reorder point were established. All of these recommendations were included in an implementation plan. Upon implementation, these recommendations are expected to decrease instances of low inventory, expedite telepack deliveries and returns, and allow CTU staff to dedicate more attention to their primary task of monitoring patient heart rhythms.
Project Summary
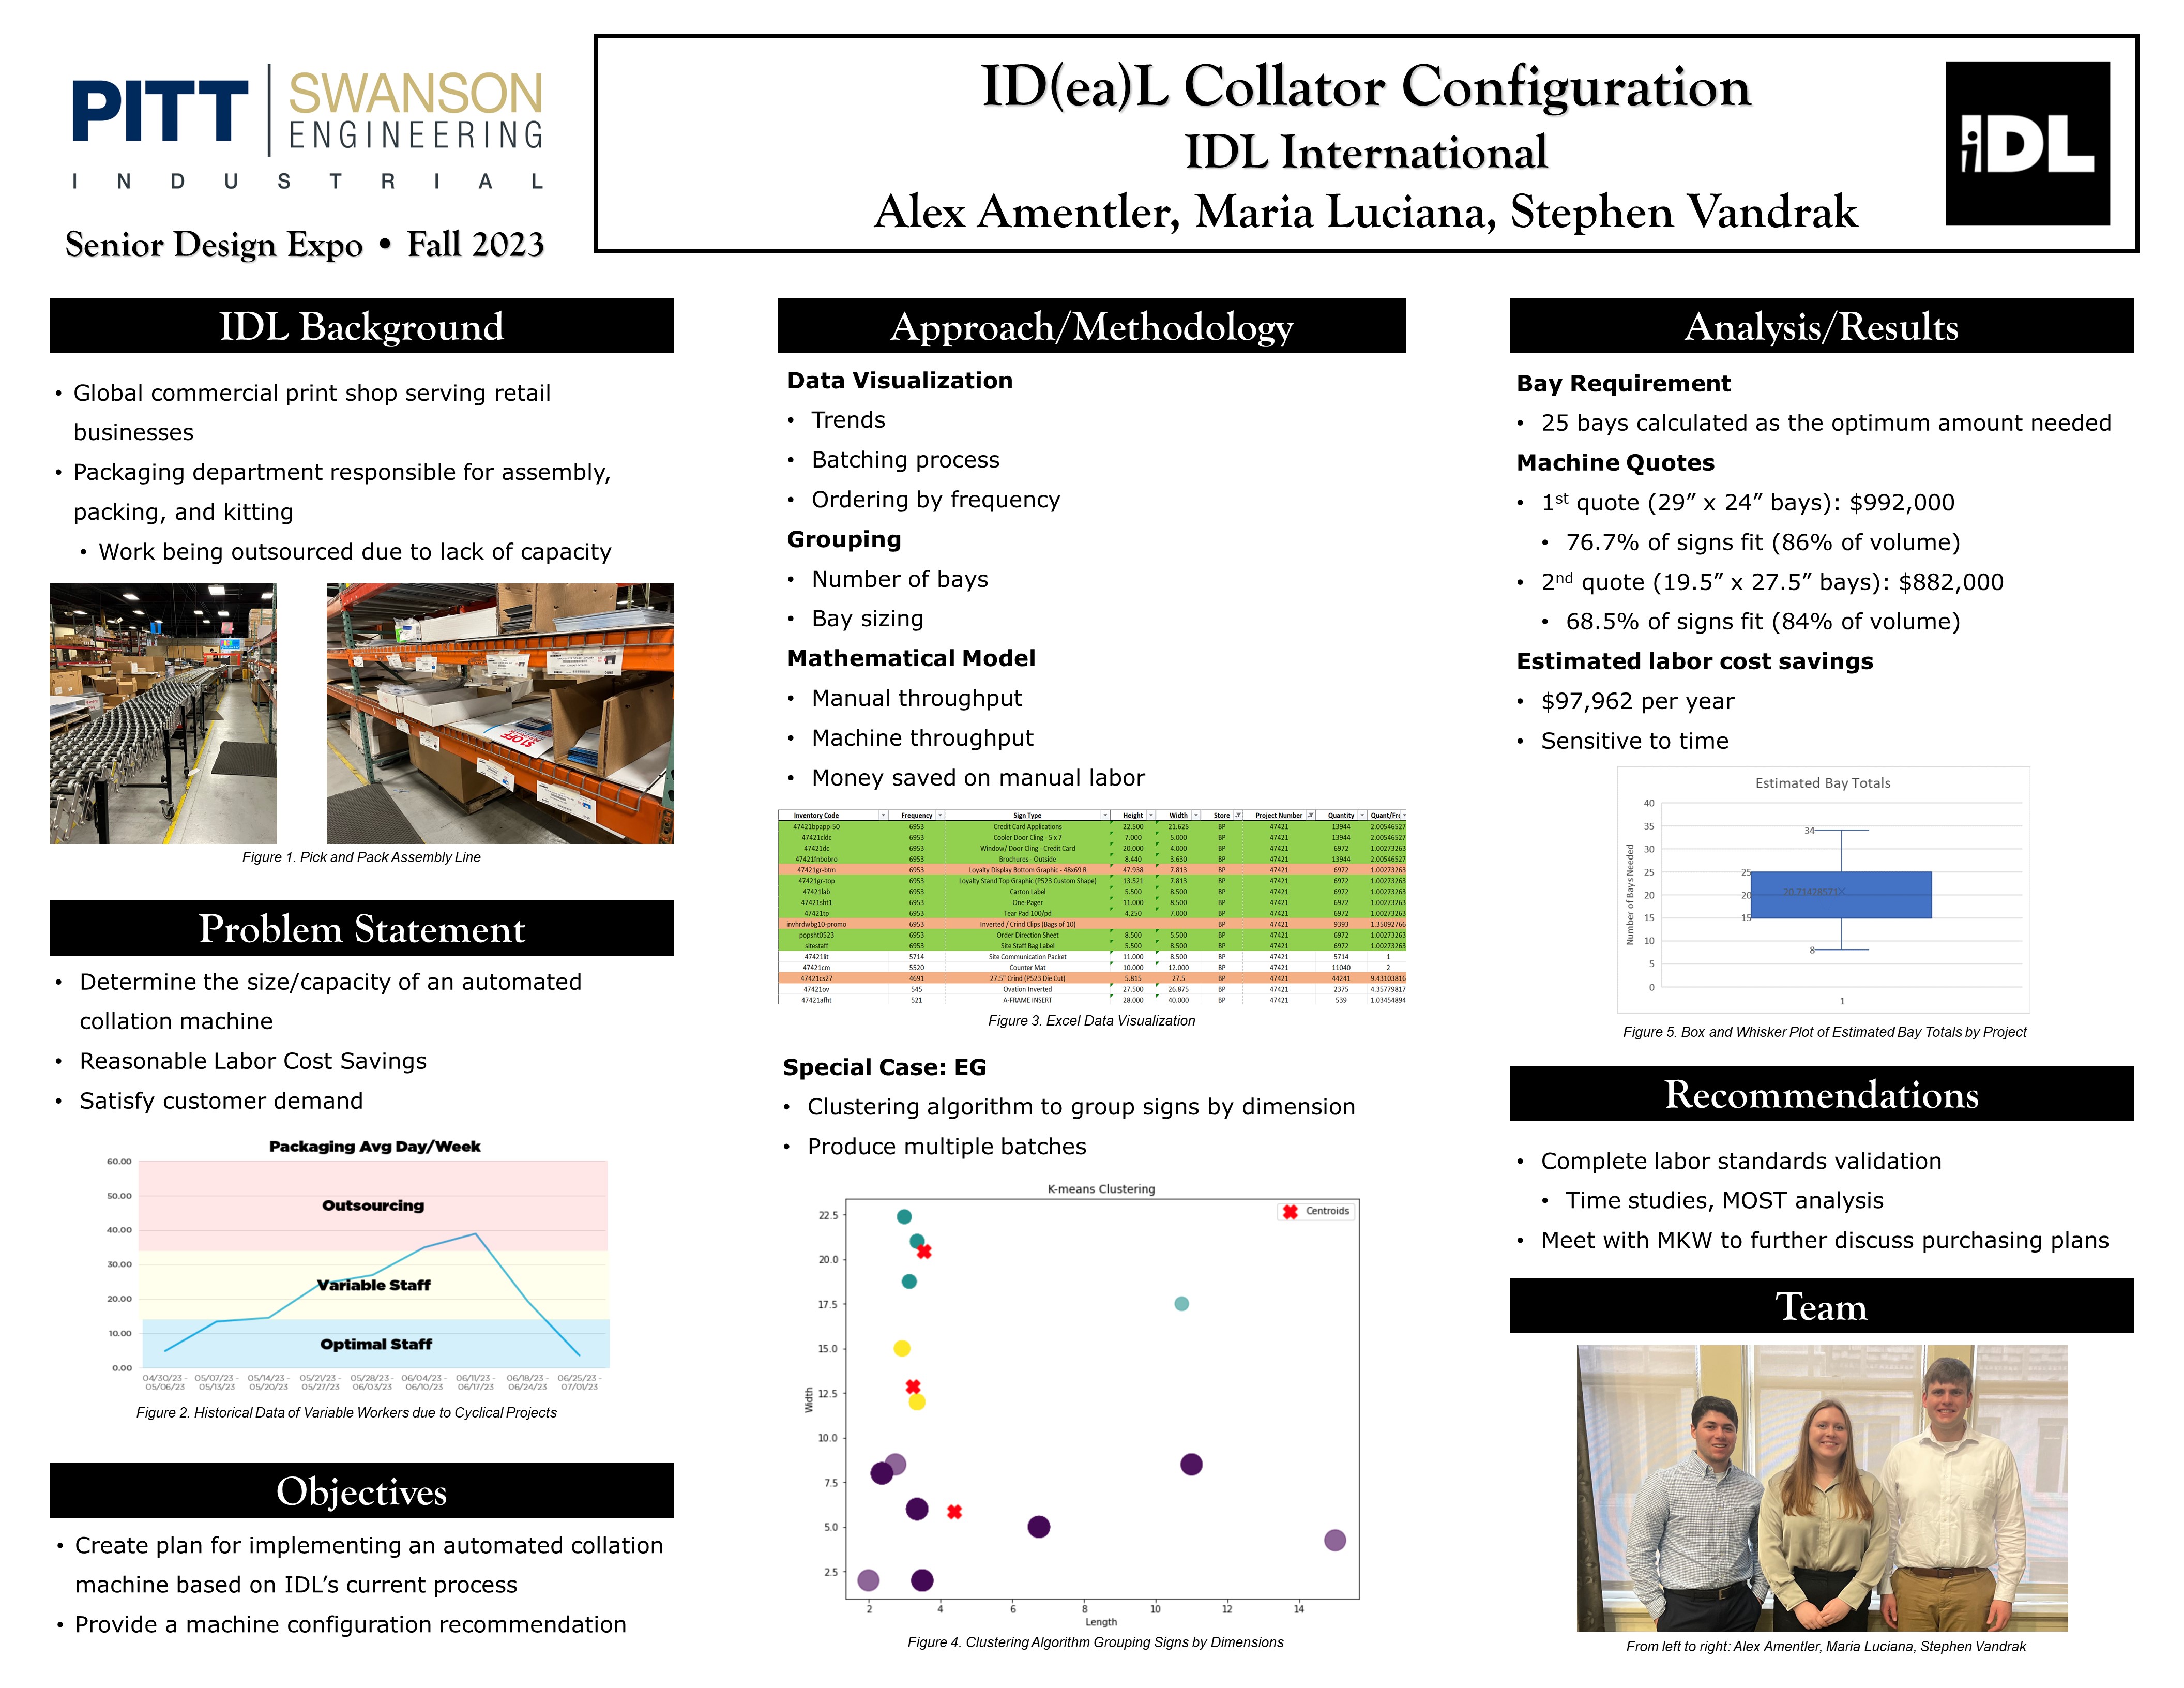
IDL Worldwide is a commercial print shop that serves brands such as Chick-fil-A, Sheetz, and Giant Eagle. They print, package, and ship signs off to stores. The team is focusing on the packaging department which is responsible for the assembly, packing, and kitting of signs. Projects are cyclical and IDL must outsource labor when they lack the capacity for fulfilling projects. Due to this nature of projects, there is an increased cost of labor and a dependency on temporary workers. The team is going to determine the size of an automated collation machine that has reasonable labor cost savings whilst satisfying customer demand. Our goals are to create a plan for implementing this machine and provide a recommendation for its configuration. The team analyzed historical data by using data visualization to identify trends of store frequencies, grouping similar frequencies to determine required bays, and a mathematical model comparing manual and machine throughput to calculate labor cost savings. One brand, EG, was a special case in which a clustering algorithm was used to group signs by dimensions to create multiple batches. The team calculated 25 bays to be optimal and received two machine quotes of $992,000 and $882,000, with the former having a bay size 29” by 24” and the latter 19.5” by 27.5”. The cost difference accounts for an increase in bay size and only accounts for a 2% increase in the volume of signs going onto the machine. The estimated labor cost savings using the machine is $97,692 per year, which is larger than IDL’s current spending on outsourcing labor. This calculation was found to be sensitive to picking time. We recommend that IDL completes labor standard validation to justify labor cost savings due to its sensitive nature, and they should meet with MKW to discuss further purchasing plans.
Project Summary
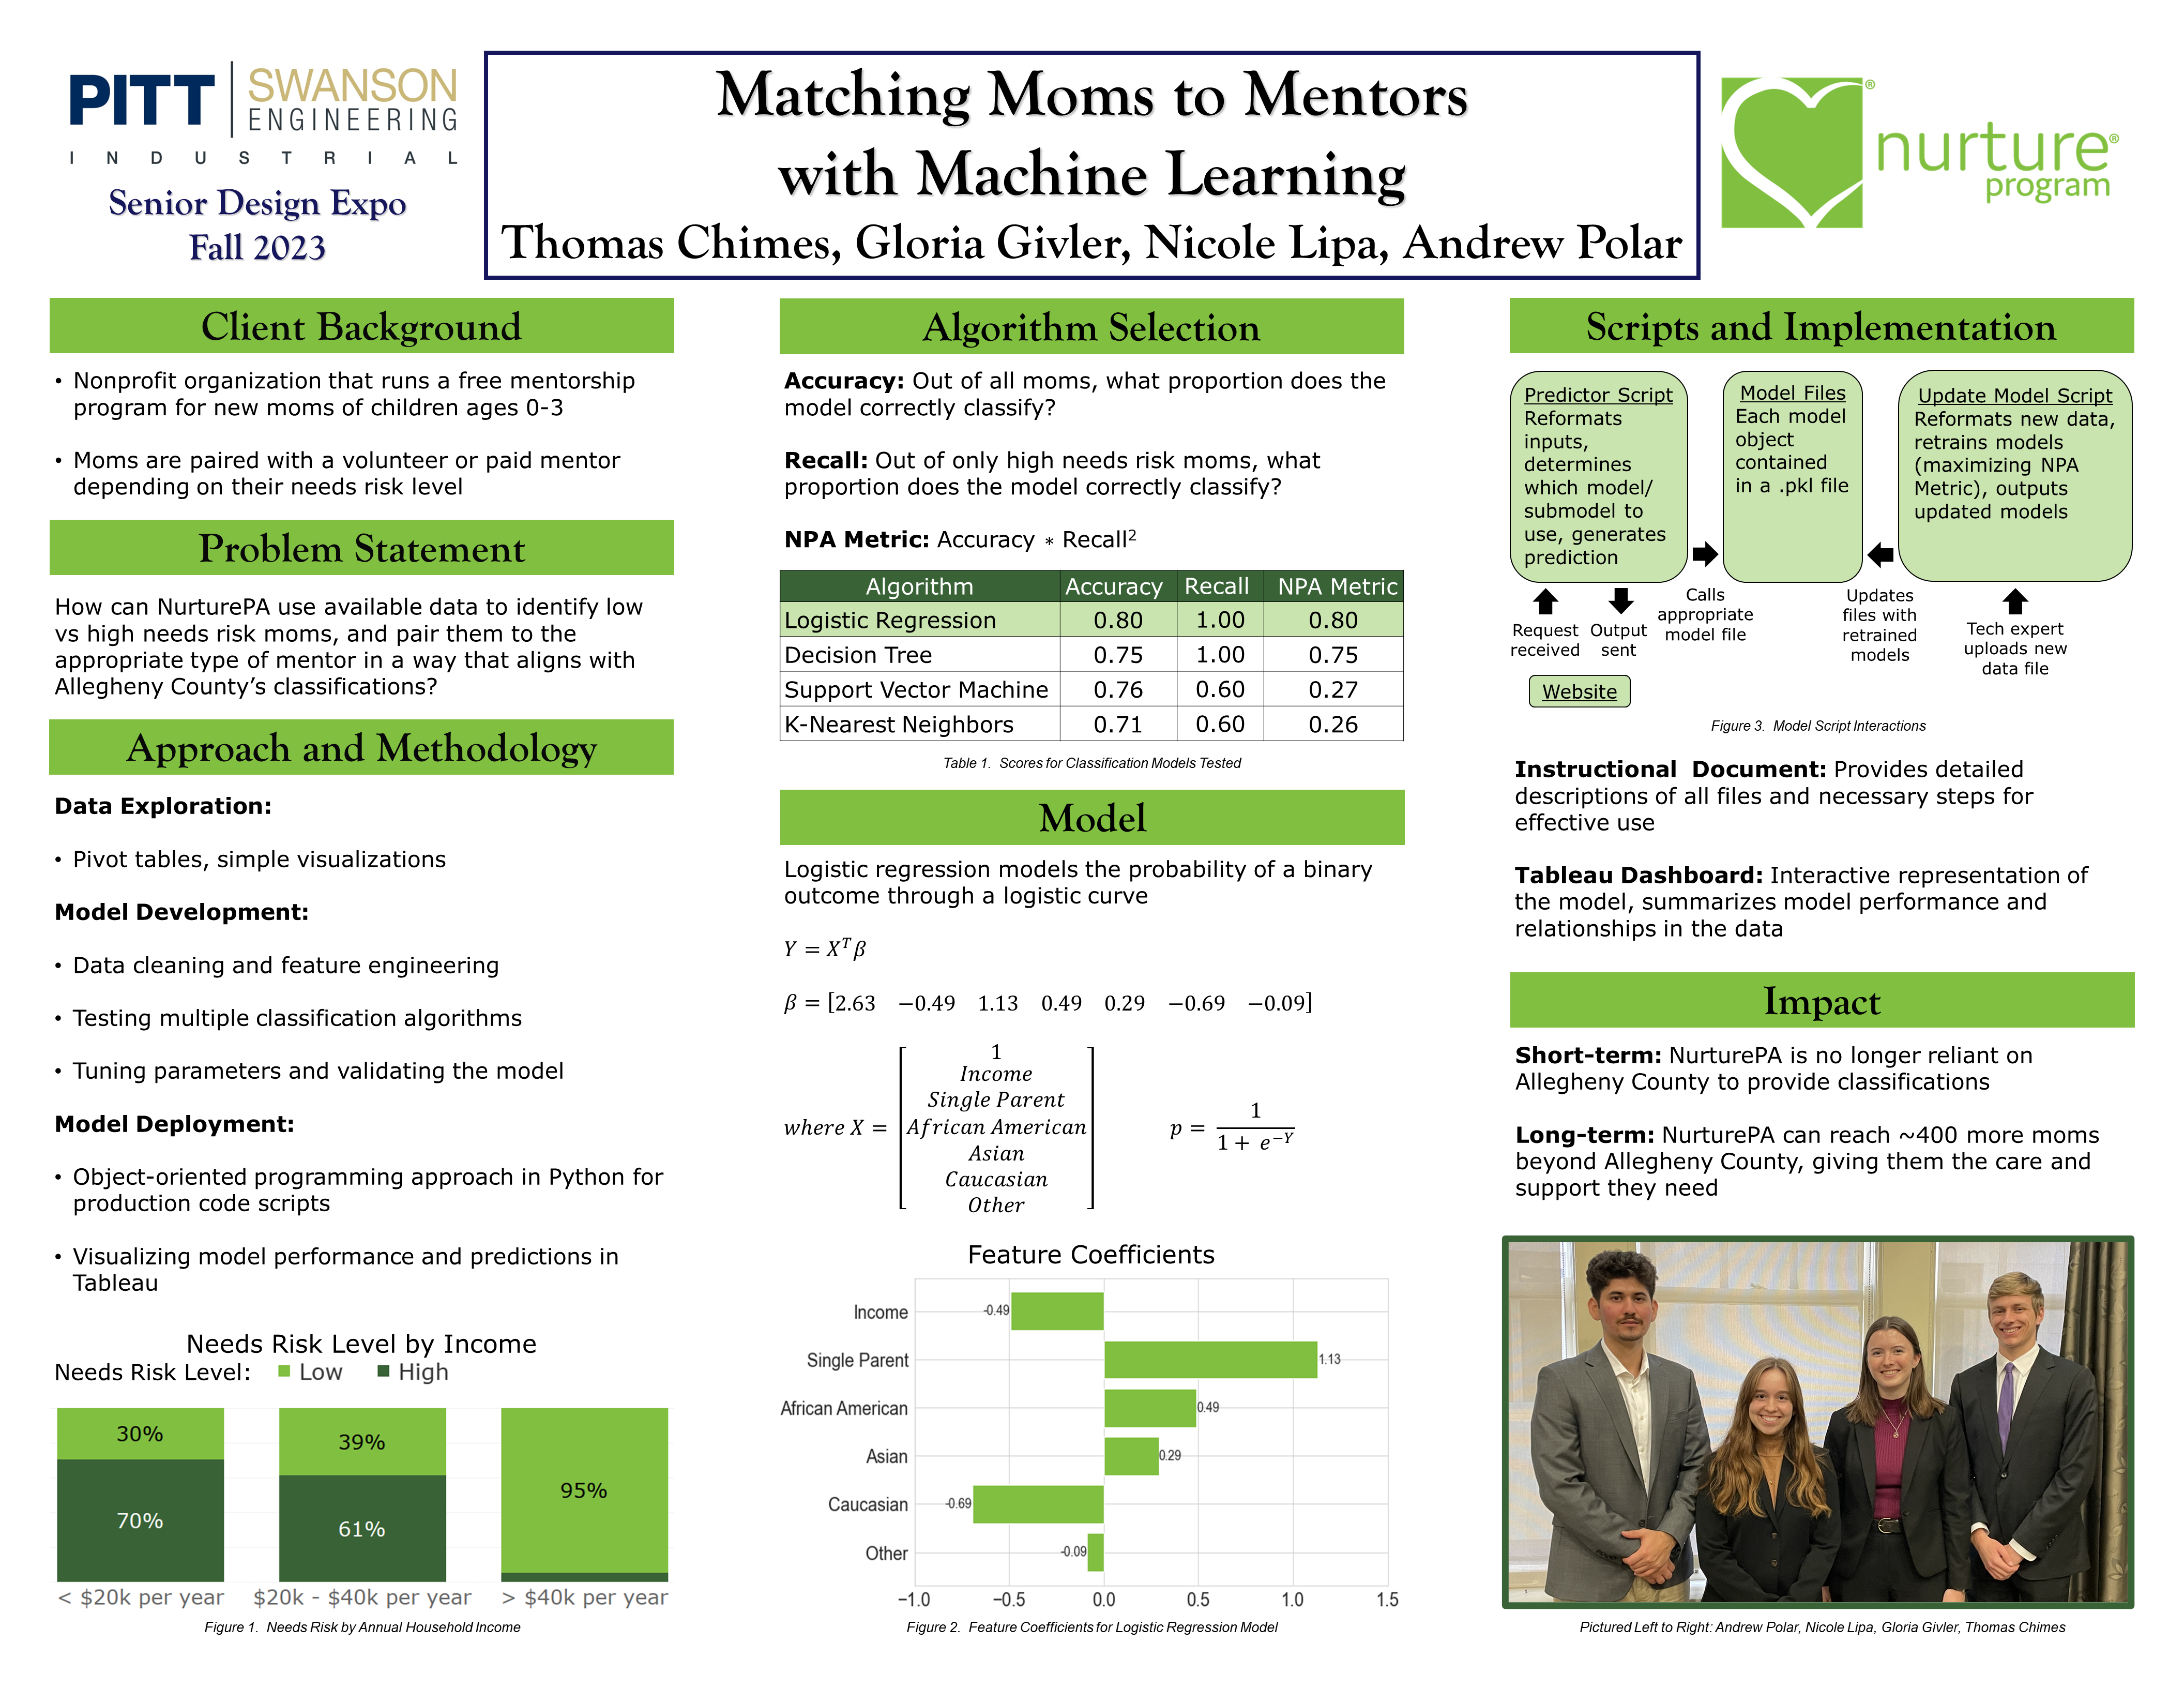
NurturePA is a nonprofit organization dedicated to promoting the social and emotional health of new mothers and their children. The organization runs a free mentorship program that pairs mothers with mentors according to the level of support they require, referred to as their “needs risk level.” Currently, NurturePA depends on Allegheny County to provide needs risk levels for each mother. However, the county is not transparent in its classification process and may stop providing classifications entirely; plus, NurturePA wishes to expand to other counties. A solution was required to identify low versus high needs risk mothers in the same way as Allegheny County but using only the data available to NurturePA.
Multiple classification algorithms were tested on data with three parameters: household income range, race, and single parent status. Algorithms’ performance was evaluated across accuracy, recall (out of only high needs risk mothers, how many are correctly classified), and a custom “NPA Metric” which combines the previous two while weighing recall more heavily. A logistic regression model performed the best and was incorporated into code scripts for prediction. When a new mother is enrolled in the program, their information can be sent to the model, and the predicted needs risk level is output to the NurturePA website. An updating script was also created–if more data is collected in the future, it can change the model based on that new data, aiming to improve performance. Additionally, a dashboard was constructed to provide visual insights into the model. It includes an interactive feature where users can select values for each parameter and the associated needs risk level prediction and probability of accuracy are displayed. As a result of this project, NurturePA can reach approximately 400 more mothers outside Allegheny County and ensure they receive the appropriate level of care and support.
Project Summary
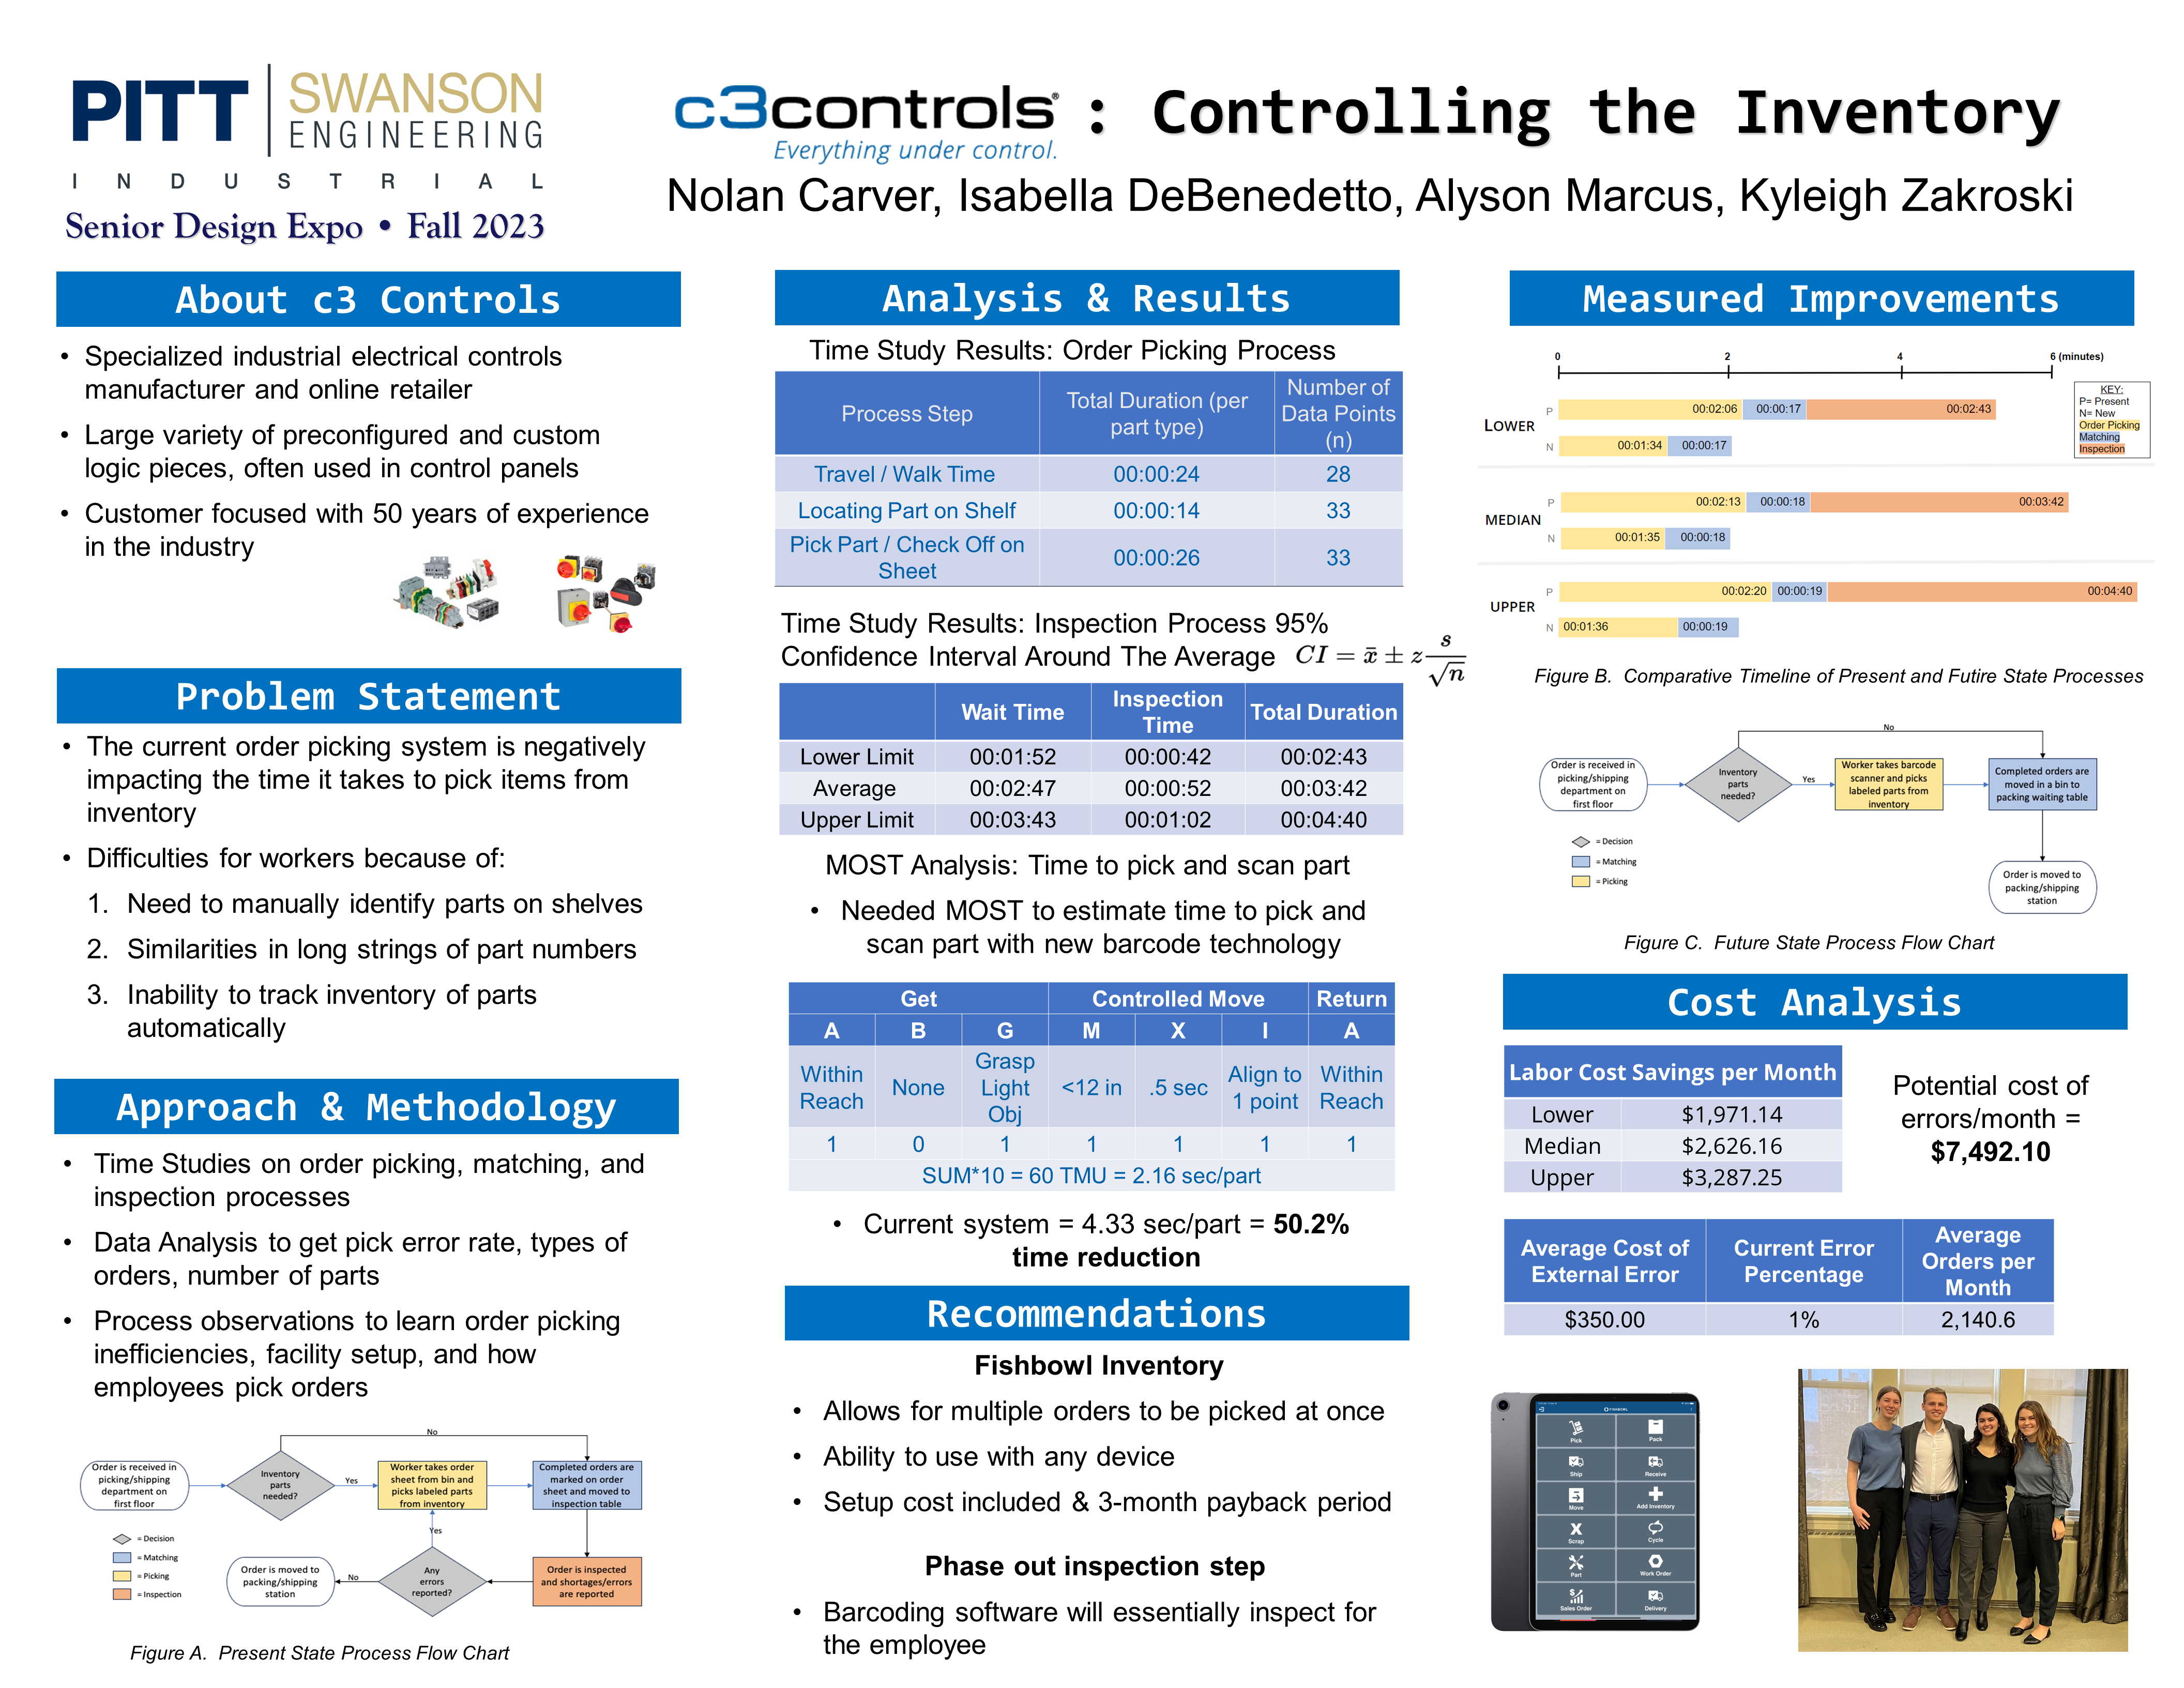
C3 Controls current order picking process is negatively impacting the time it takes to pick items from inventory. The current process is very manual, requires employees to compare long part numbers between products and order sheets, and is not able to automatically track the inventory of these parts. Time studies, analysis on provided data, and process observations were conducted to identify the current state order picking times, inspection time, pick error rate, and process inefficiencies. Studies showed room for improvement through reduction of time to pick parts and elimination of the inspection step with implementation of a barcoding software. Literary research provided evidence that barcoding technology has the ability to reduce human errors. This barcoding software will essentially perform the inspection step for employees automatically, hence removing the need for that additional step. A MOST analysis was conducted to further prove the barcoding technologies ability to reduce order picking time through shortening the time to pick a part from the shelf. Utilizing these assumptions, a new order picking time was estimated. From here, a cost analysis was conducted using the new process time savings and employee hourly wage. These values and potential vendor costs were used in predicting a payback period for two different suppliers. C3 Controls has the potential to shorten their order picking process time and automate their inventory tracking by utilizing a barcoding software like that provided by Fishbowl Inventory.
Project Summary
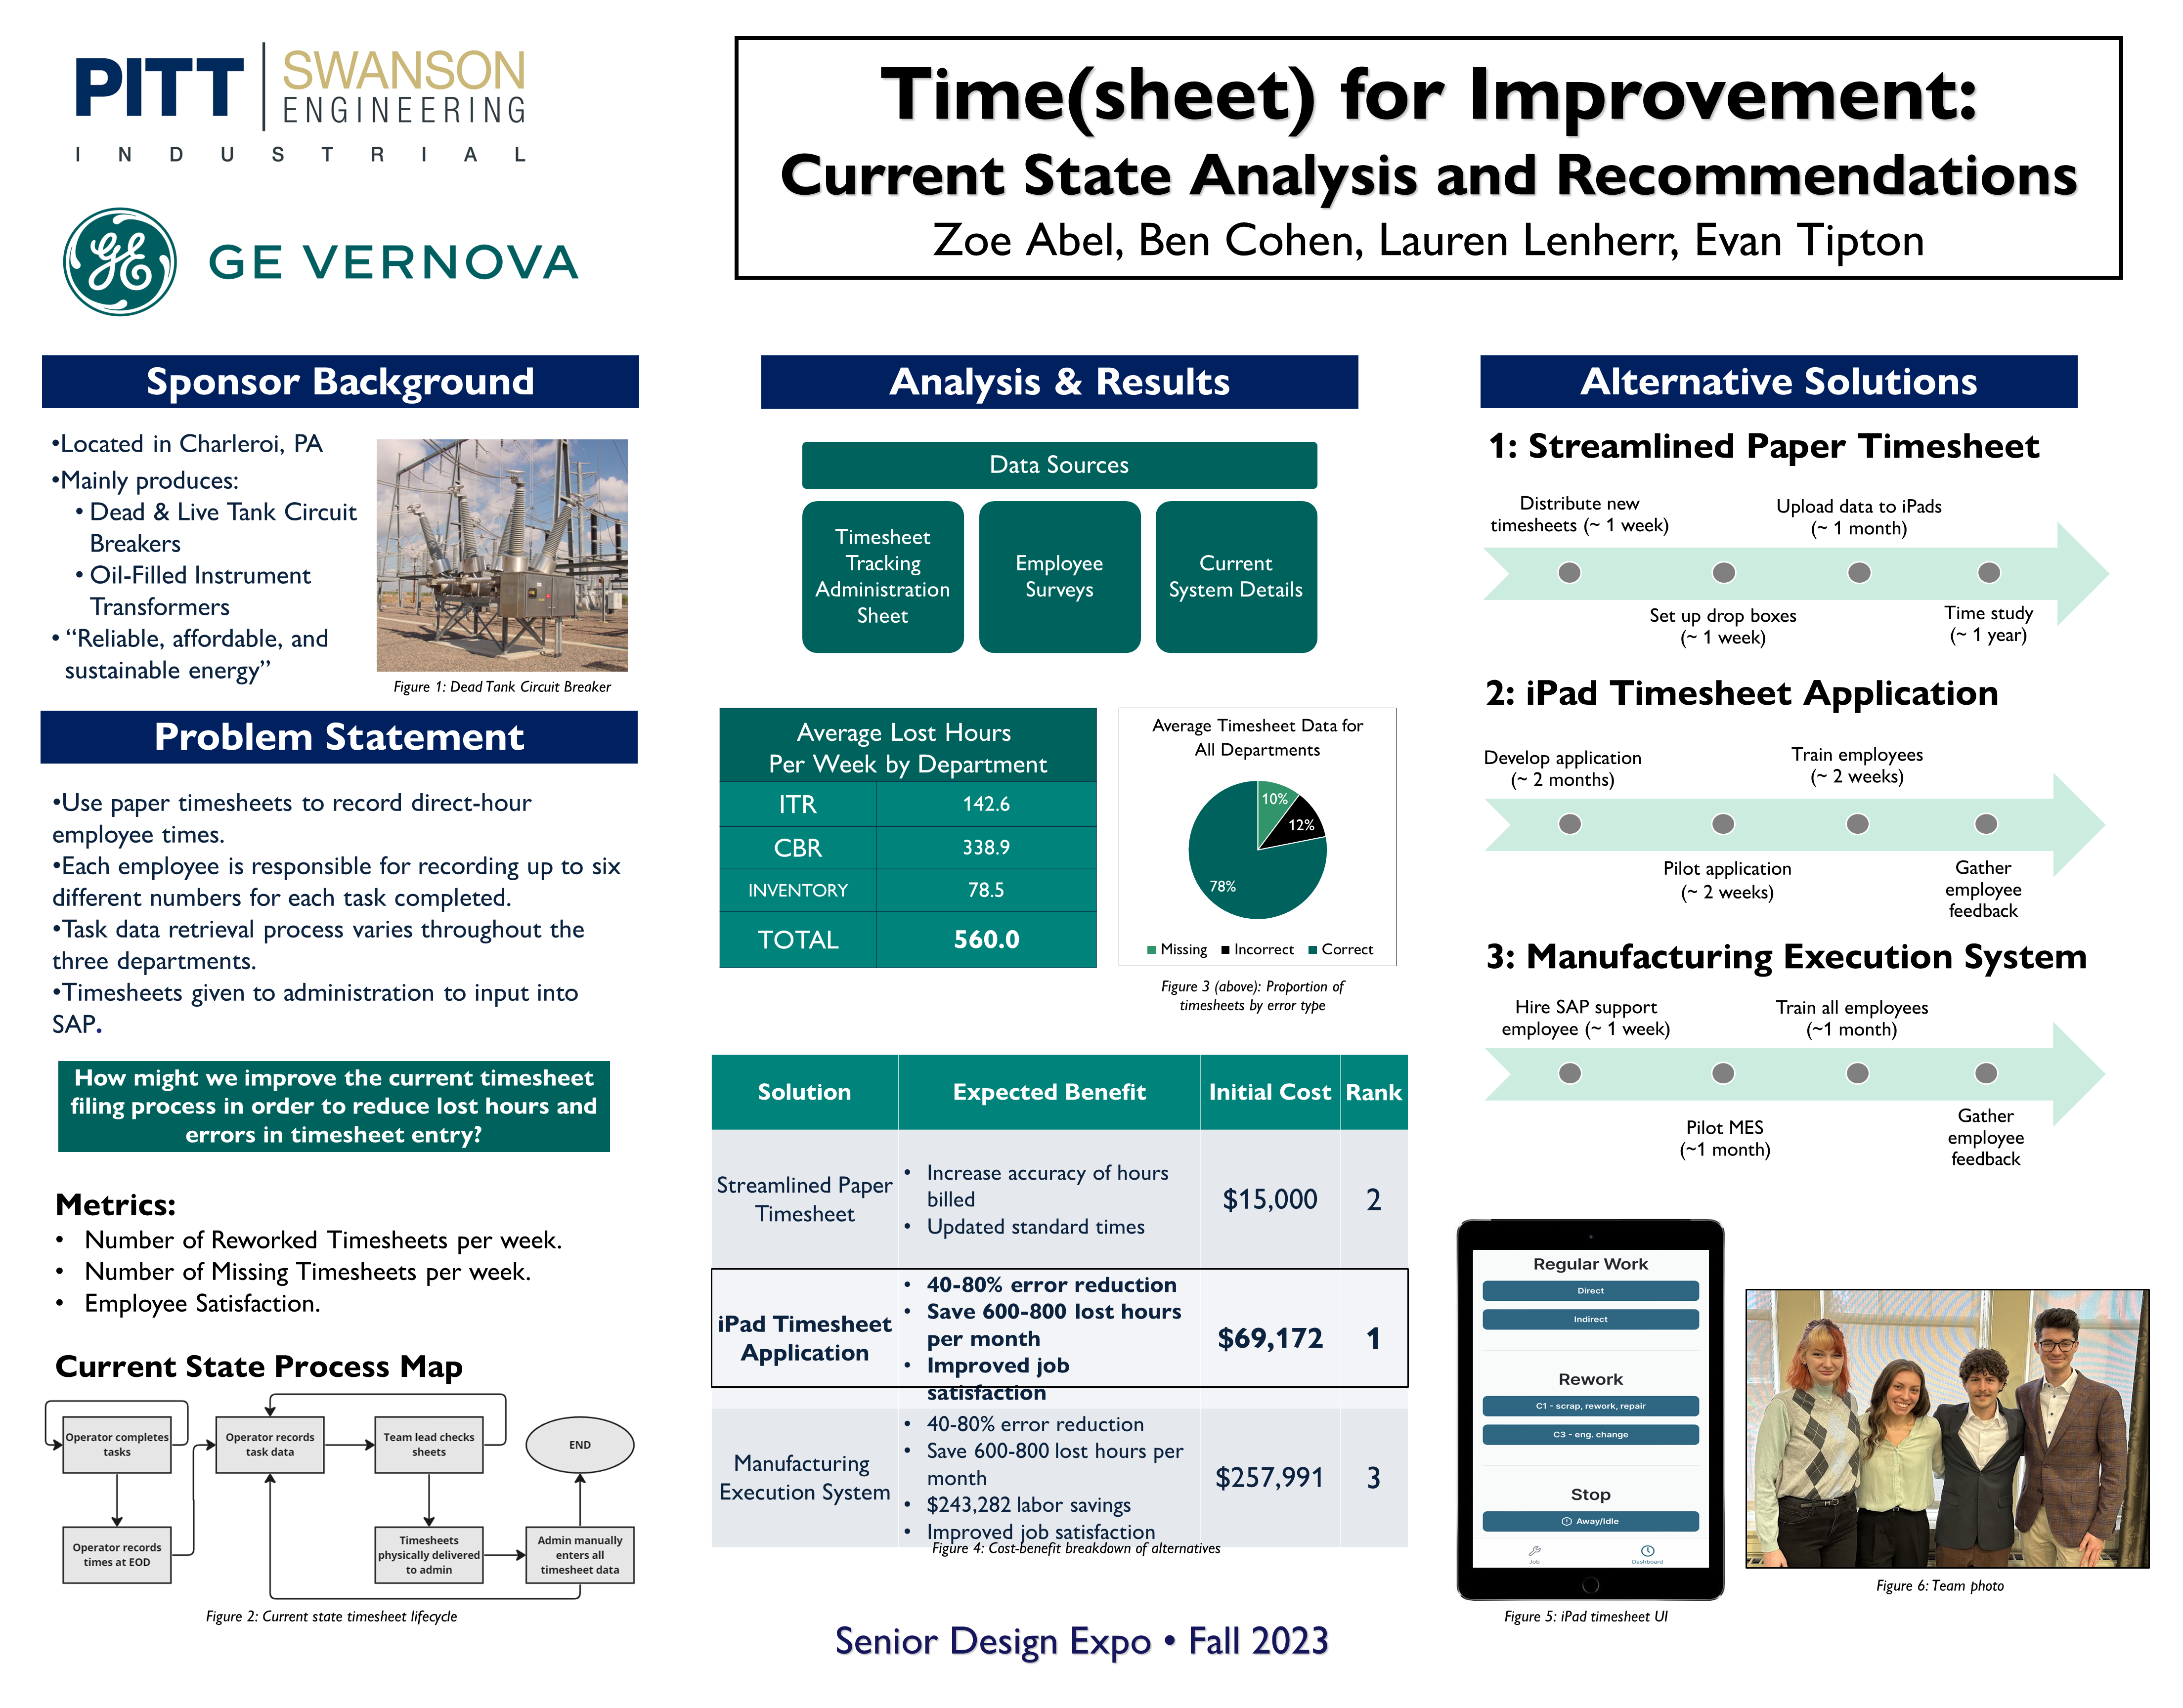
This project aimed to improve the timesheet process at GE Vernova, located in Charleroi, PA, by exploring alternatives to the current paper-based system. Initially, the team conducted a comprehensive analysis of the existing process in all three departments.
The investigation revealed significant issues with error rates and missing timesheets, resulting in approximately 560 hours of lost time each week. To address these concerns, three potential solutions were developed: a streamlined paper timesheet, an iPad application, and the implementation of a manufacturing execution system (MES).
These alternatives were compared in an effort to evaluate their ability to mitigate errors and enhance visibility for both employees and management. The streamlined paper timesheet was designed to standardize the process in the three departments and enforce an error check. The iPad application and MES were identified as highly effective in reducing errors and ensuring comprehensive data entry without manual input. In addition, detailed implementation plans were created for each alternative.
A final recommendation was formulated based on a cost-benefit analysis, highlighting the integration of the iPad application with existing systems as the most viable solution for GE Vernova.
In conclusion, this project presents feasible and pragmatic alternatives to the current paper-based timesheet system, emphasizing significant reductions in errors and lost hours available through the adoption of modernized solutions.
Spring 2023 Design Expo


Spring 2023 Projects
Project Summary
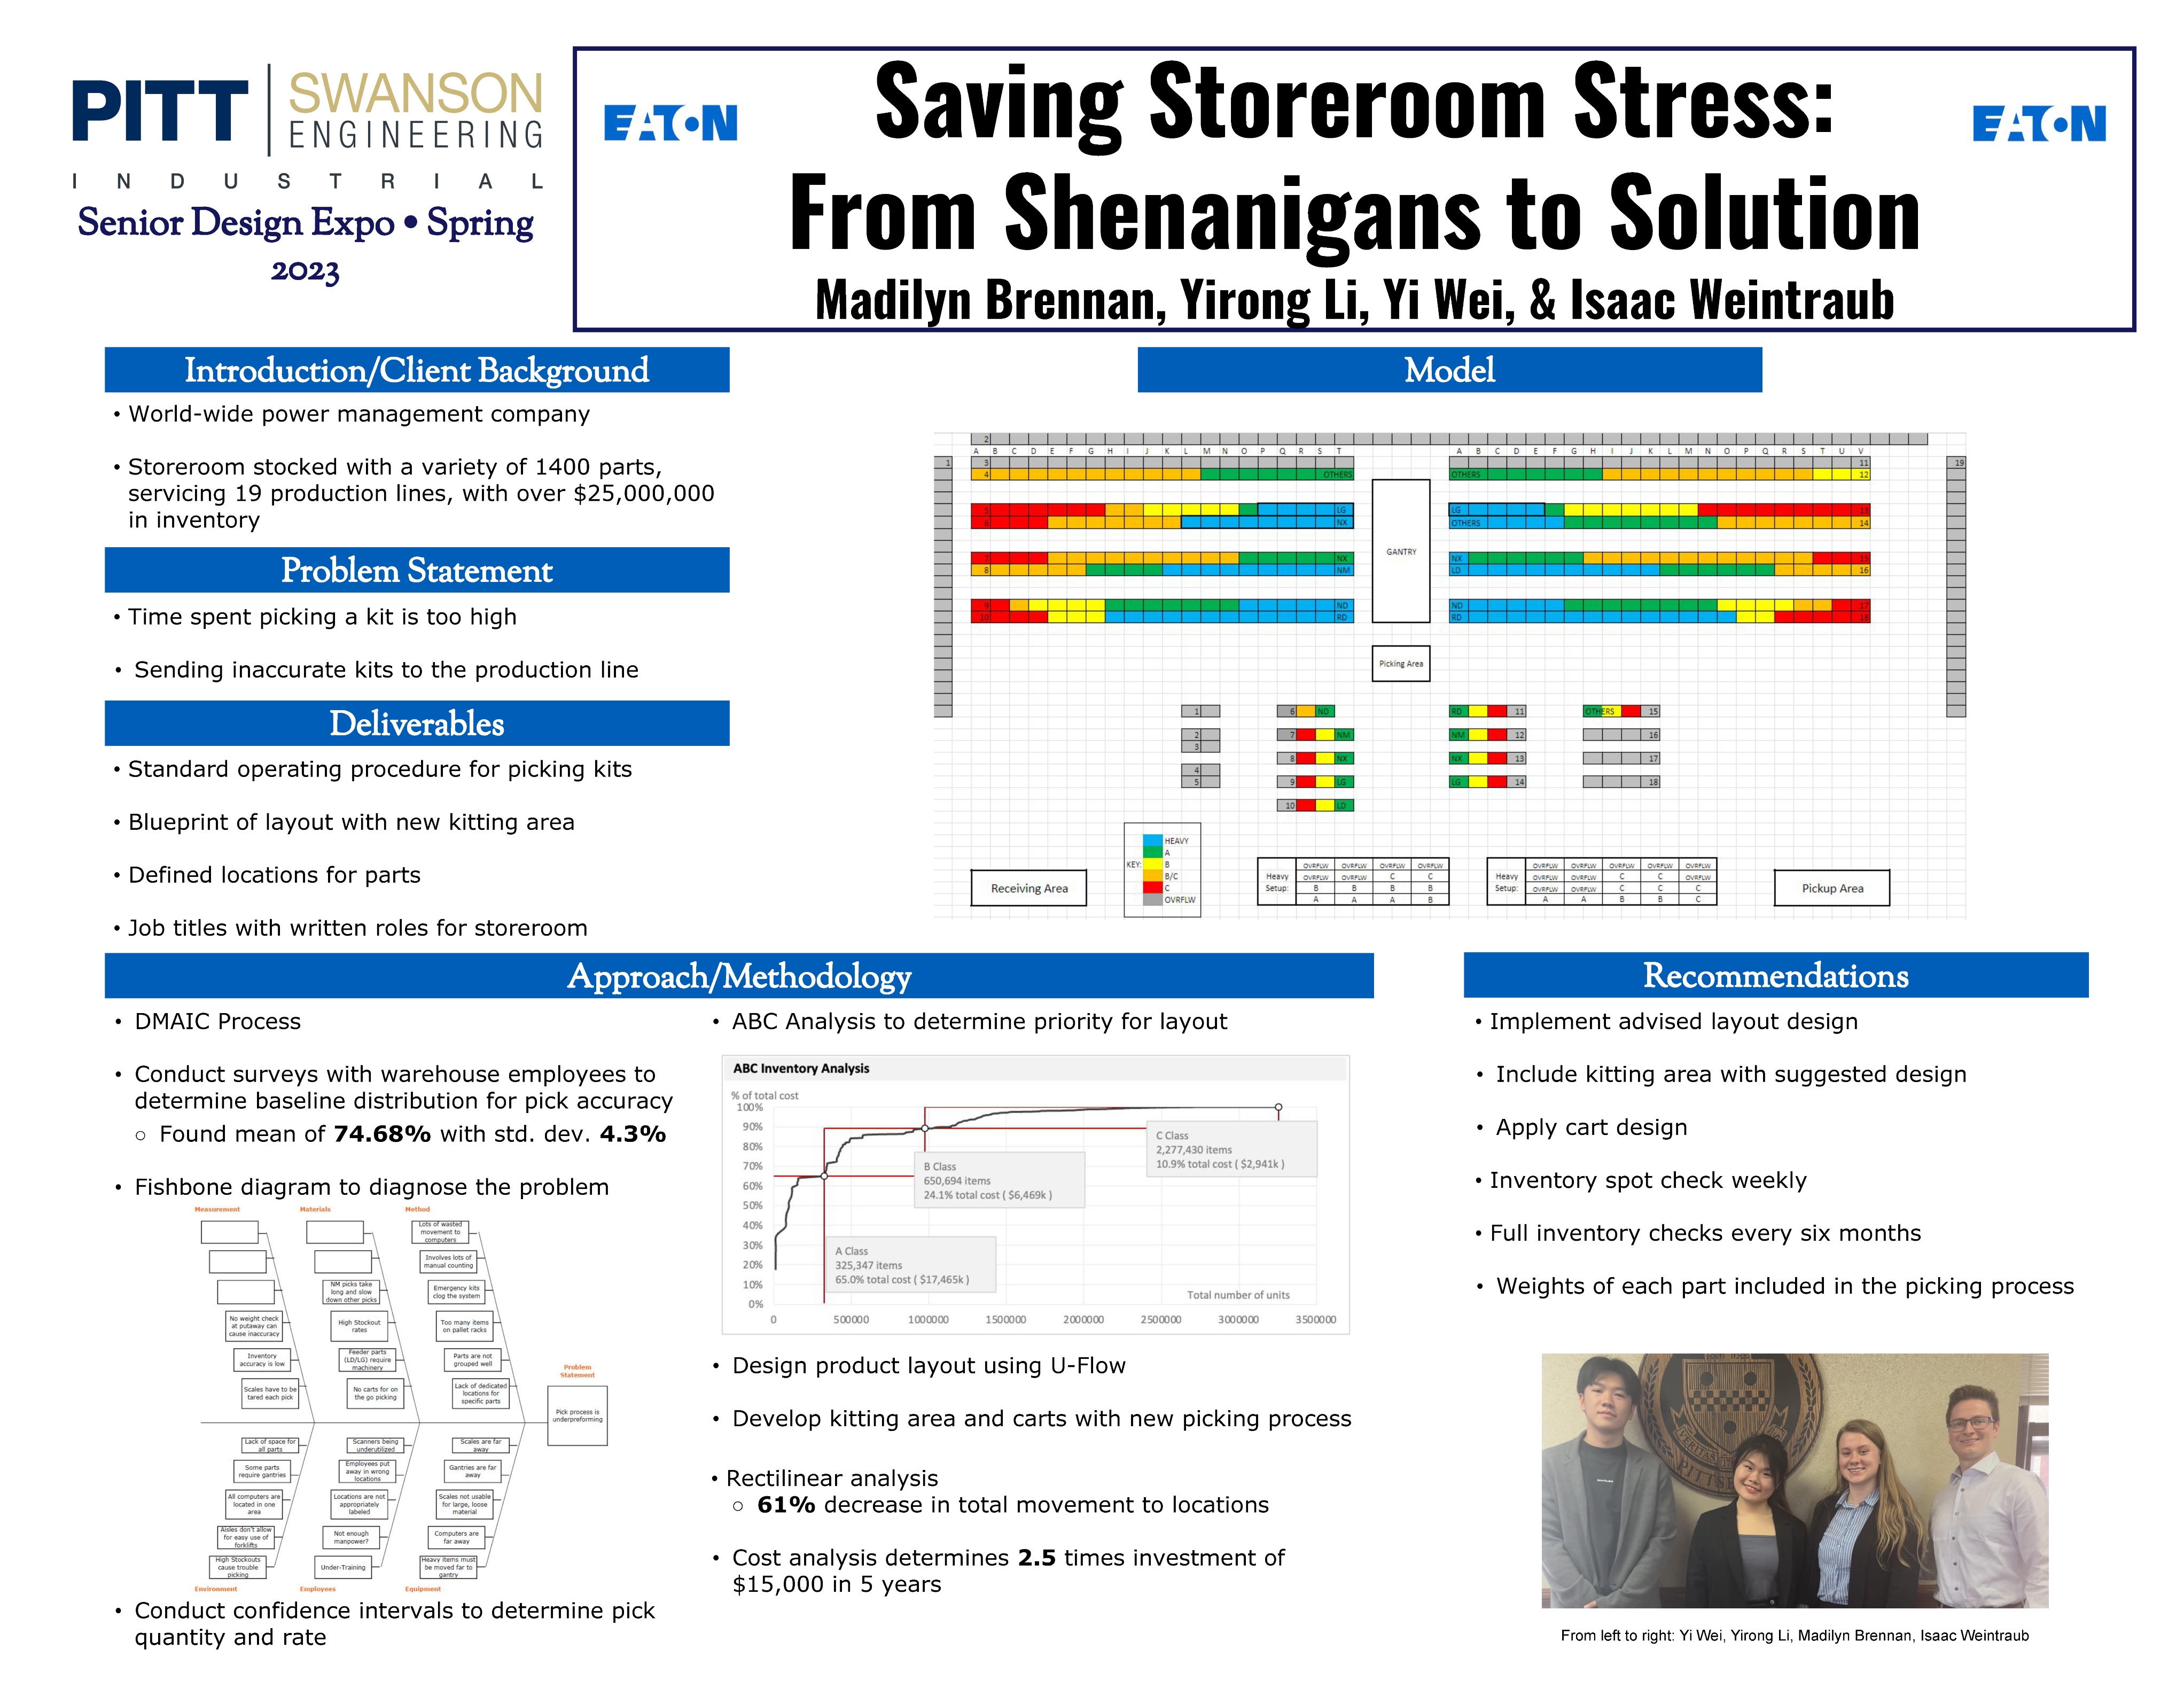
Eaton is a power management company that produces electronic breakers for worldwide clients. Their warehouse in Beaver, PA contains over $26,000,000 of inventory and storage was overcrowded, unorganized, and lacked discipline. This caused slow and inaccurate “kits” to be sent to production lines, which slowed production as a whole. Eaton contracted our group out to solve this issue. Through Eaton’s and our own collected data, we determined a set of root causes through a fishbone analysis. After this, baseline rates for picking inventory and inventory accuracy were calculated. We then used principles of industrial engineering to develop a set of recommended solutions to target these root causes which will be soon adopted by Eaton’s production plant. These solutions included a full new layout with permanent locations for over 1,400 different parts, a new area designed specifically for creating kits, and new carts designed with ergonomics in mind for the employees who pick the inventory. This permanent layout used our group’s ABC analysis as well as principles of material handling equipment to create an intuitive, easy to learn storage solution. With new roles came a new process for picking, so our group then created a new process flow map. With these new recommendations, we were able to cut wasted movement down by at least 60%, resulting in a greater pick rate. With the new layout and a proposed control plan, the inventory accuracy would increase by over 40%, resulting in accurate kits arriving at the production lines. After creating our deliverables, we conducted a cost analysis for the project and determined a return of investment of 2.6 times the investment after five years.
Project Summary
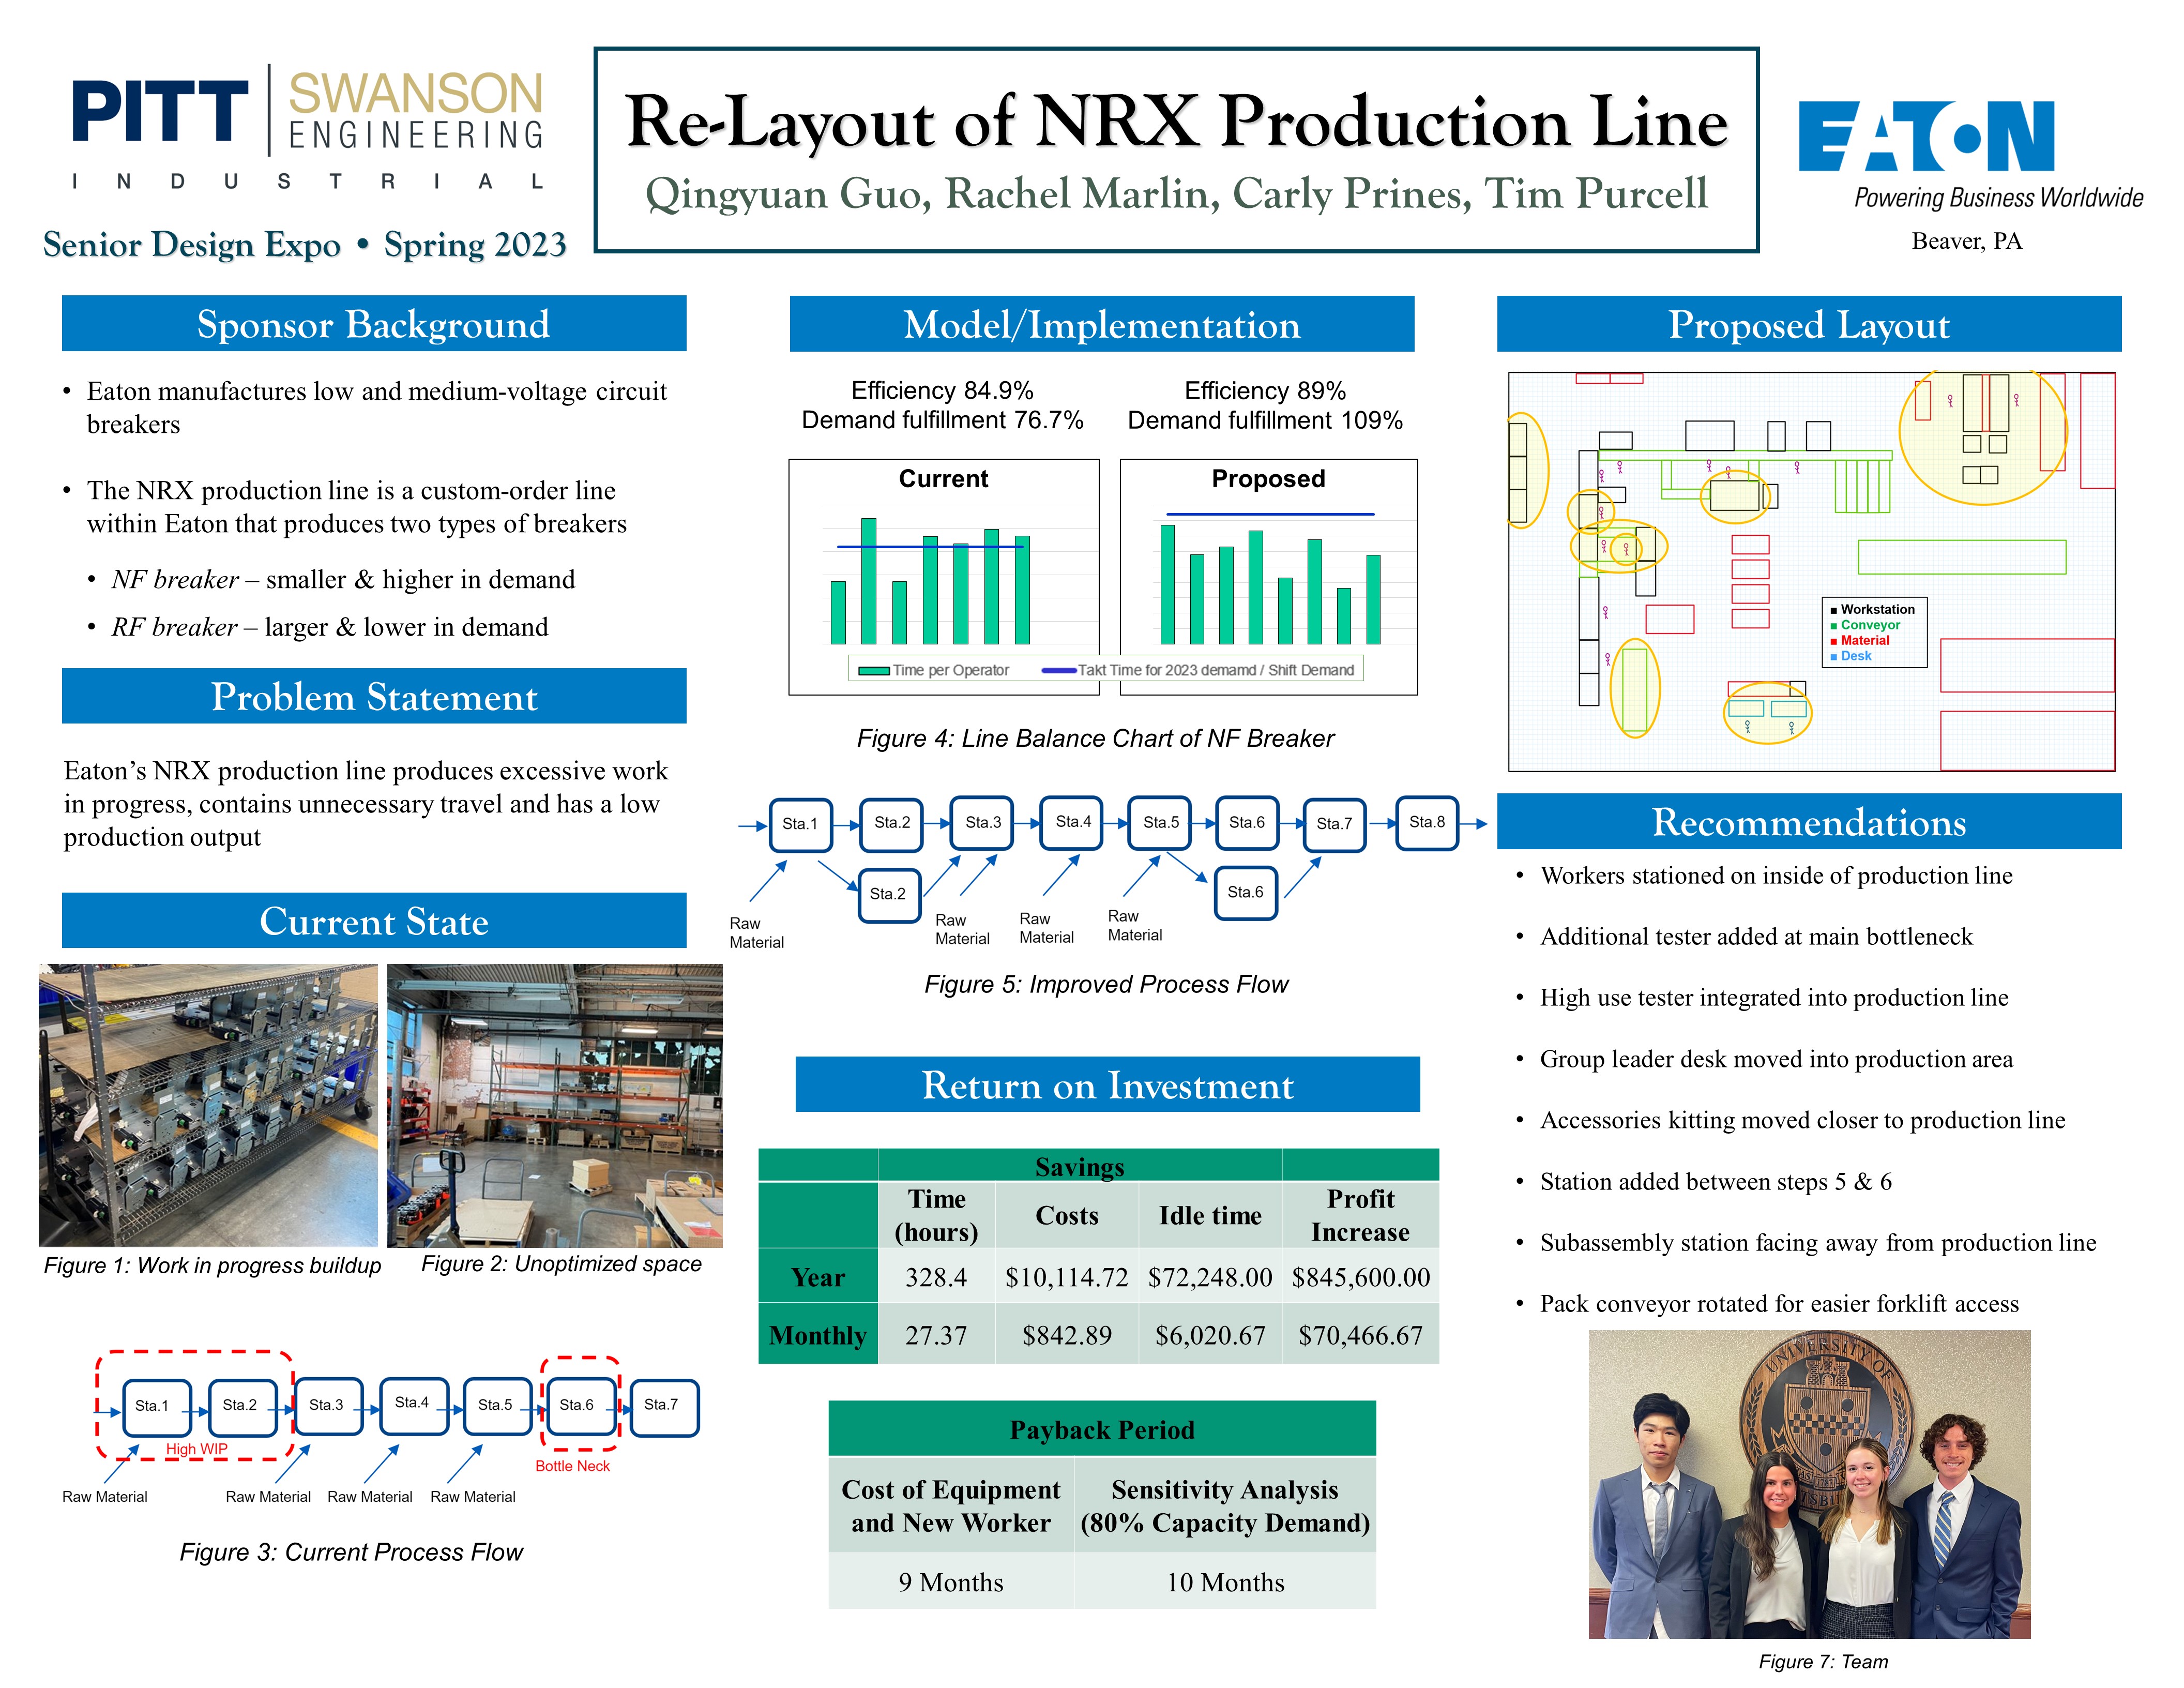
Eaton corporation is power management company located in Beaver, PA. Currently, their NRX production line, a line producing two types of low voltage circuit breakers, is inefficient, utilizes poor material management, has unnecessary operator travel, and has a low production output. Our team worked closely with Eaton’s operations team to identify the causes of these inefficiencies and problems.
The current line is configured in a U-shape with operators positioned on the outside. By first moving them to the inside of the line, workers will be able to flex and switch to different stations efficiently. The breaker accessories and kitting areas can be moved closer to the main line to reduce the amount of time spent walking by operators. Additionally, machinery that is favored by operators can be moved into the main production line to reduce breaker travel time originally done via rolled carts. There is one main bottleneck station early in the process that leads to high work in process between stations. The Senior Design Team also concluded that it would be in the best decision to purchase additional machinery at this test station to increase throughput to other stations on the line. The additional machinery would add an additional operator to operate the line, but this would produce a return on investment of only 8 months due to the profit from increased production of circuit breakers and reduced travel time.
Project Summary
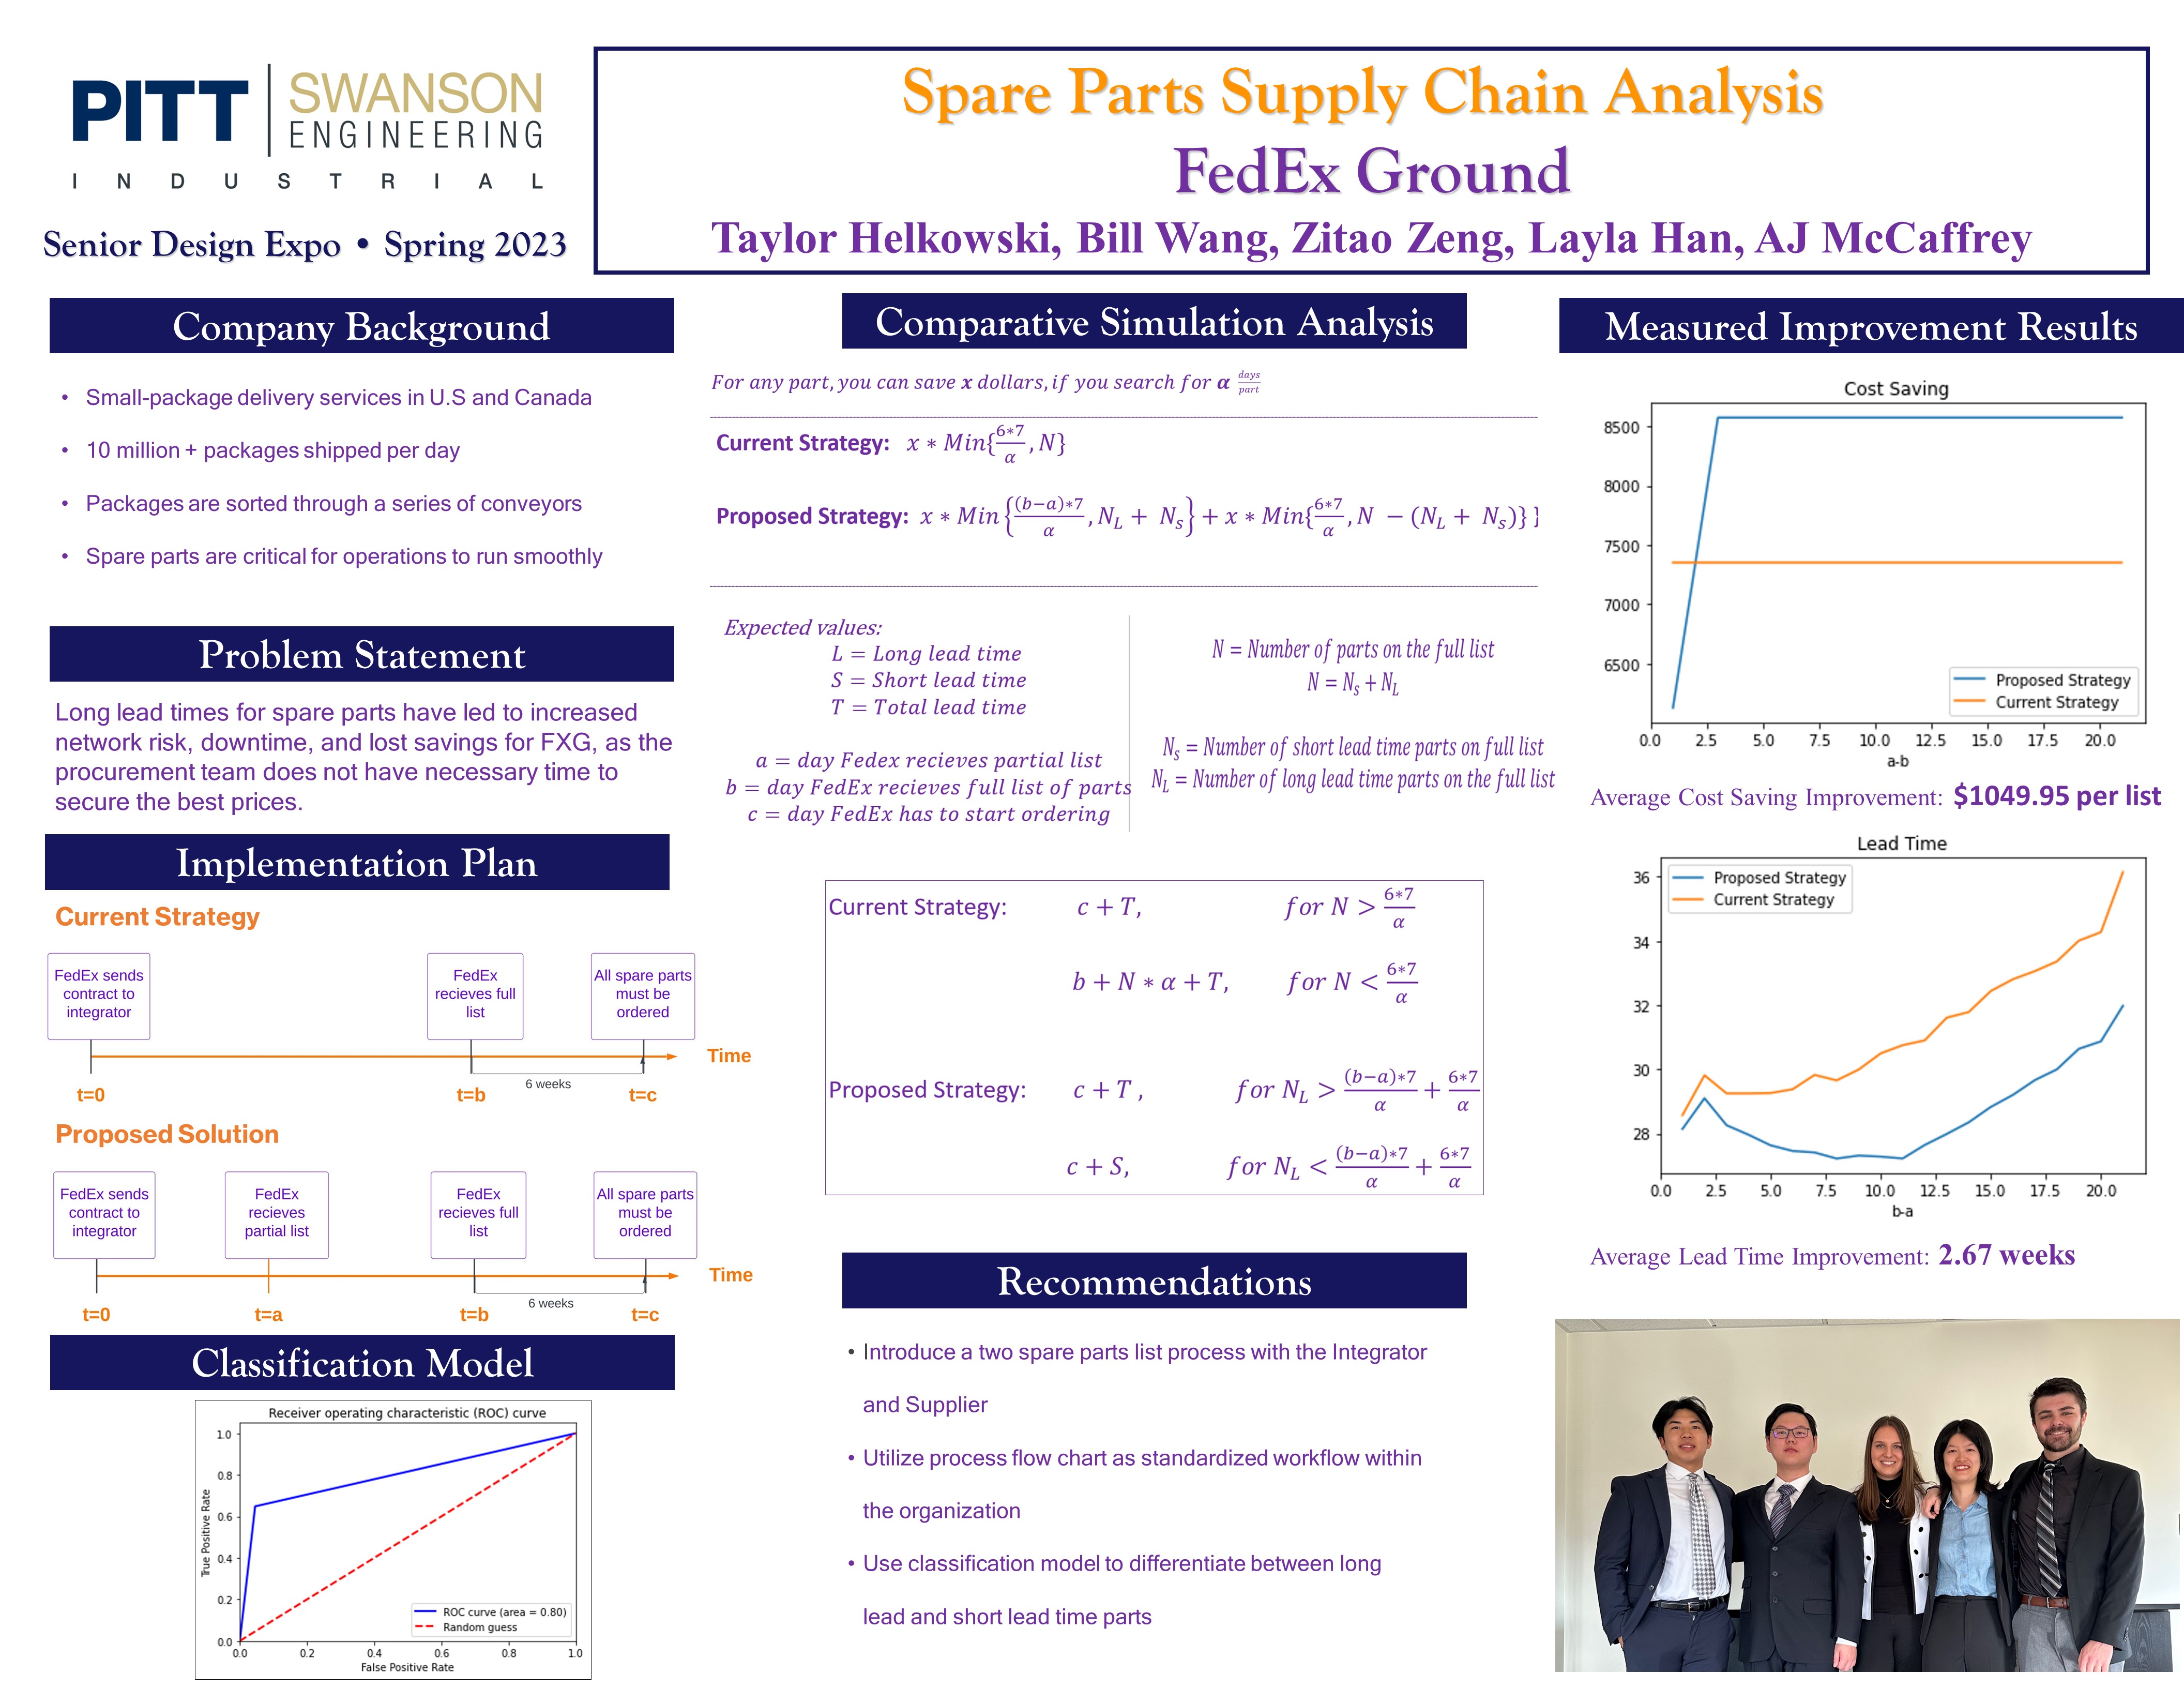
FedEx Ground is currently experiencing long lead times for spare parts that has led to increased network risk, downtime, and lost savings as the procurement team does not have the necessary time to secure the best prices. The current process for acquiring the spare parts goes through five different departmental teams before ordering can begin. If anything is missing from the list along the way, it is sent back to the supplier and the entire process starts over. This can take several weeks to receive the completed list and takes away the procurement teams' time searching the market for the best prices, forcing them to purchase all the parts from the integrator. Our approach to the problem was to focus on what can be fixed on the FedEx side of the process, as we have no control over the integrators or suppliers' actions. Our suggestion is to introduce a two-list process that will allow the procurement time to have more time to look for more parts and reduce the number of parts they must purchase from the integrator. Using a statistical analysis, a classification model, and a simulation model, we can model the current process and compare it to our proposed solution using cost savings and max lead time as our metrics. Using these metrics, we were able to determine an increase in cost savings of $1049.95 per list and a decrease in max lead time of 2.67 weeks by implementing our prosed solution. Our final recommendations are to implement this two-list process as the standard workflow and utilize the classification model to predict future lead times for both short and long lead time parts.
Project Summary
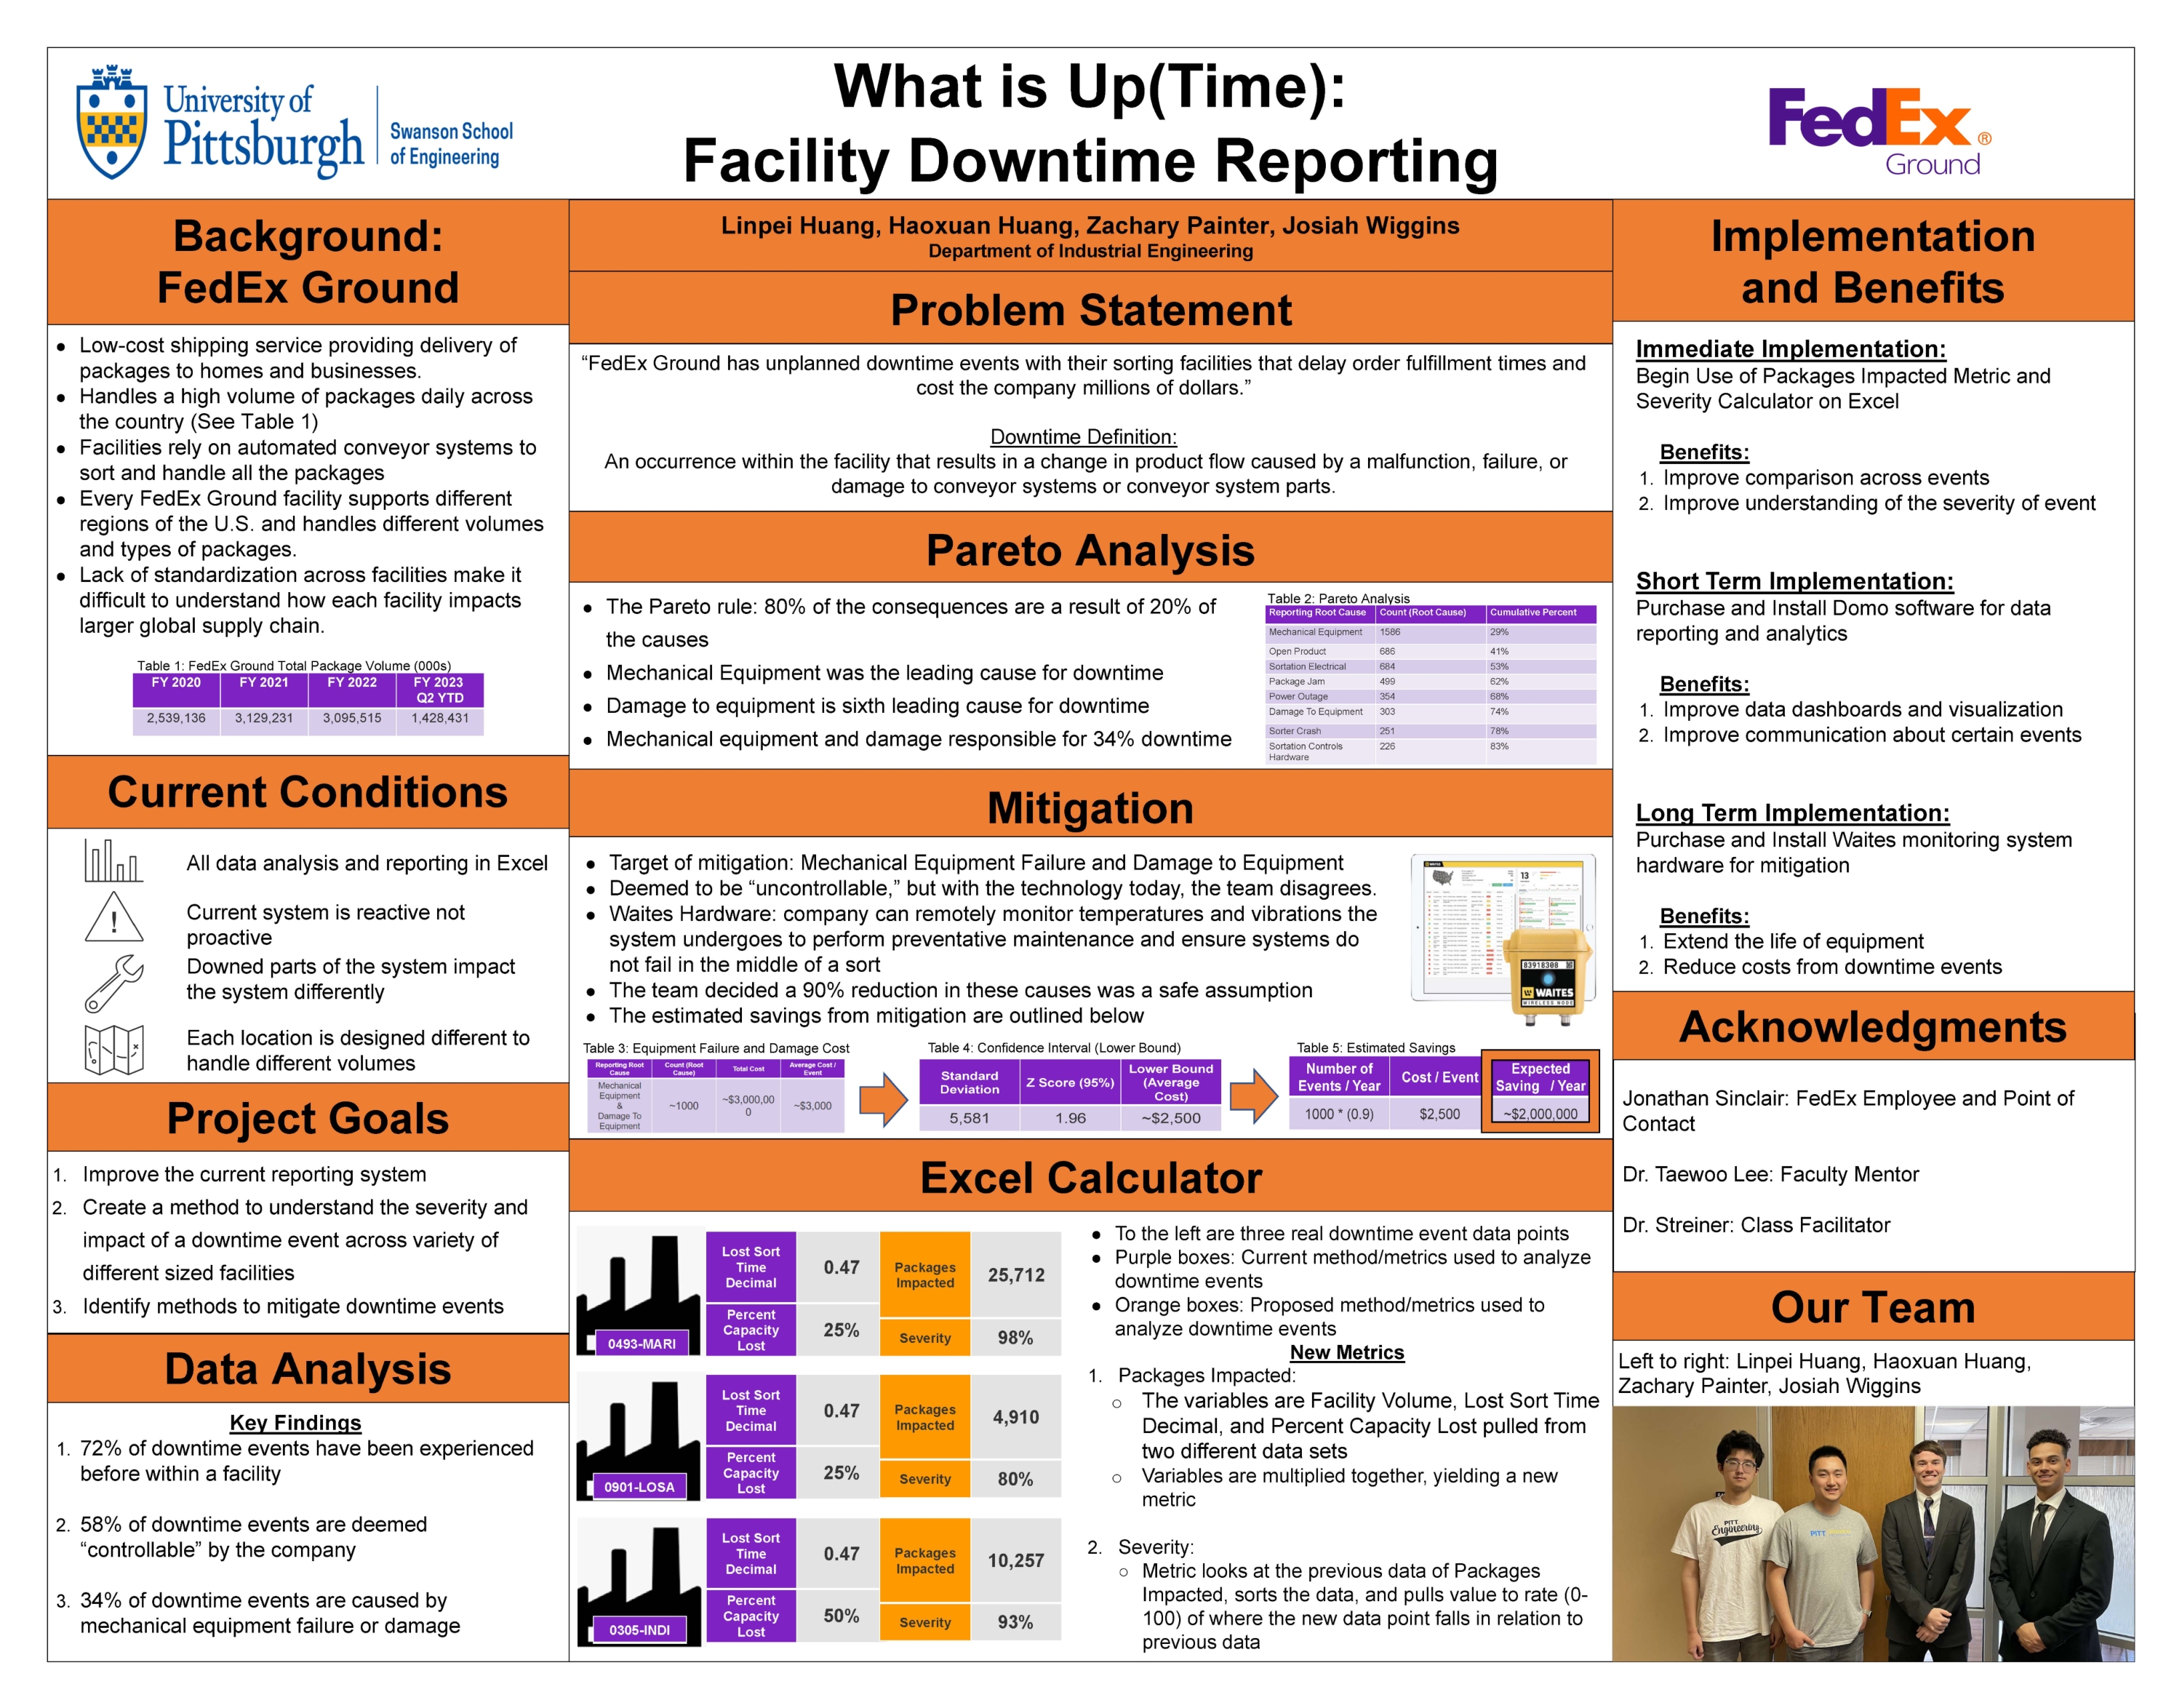
FedEx Ground is the low-cost ground shipping service that prides itself on being a faster alternative to UPS Ground with shipping times within the United States. With facilities nationwide, FedEx Ground relies on conveyor systems to handle and sort packages in each facility. FedEx Ground has unplanned downtime events with their sorting facilities that delay order fulfillment times and cost the company millions of dollars. Additionally, FedEx Ground has recognized that their current method of tracking such issues is insufficient. To address these issues, the team successfully created two new metrics for the company to implement immediately into their analysis. The new metrics allow for a clear comparison across different facility sizes, and improve the understanding of a downtime event. Additionally, the team recommends the implementation of Domo, a reporting software to improve communications and analysis of events. Finally, the team found that equipment damage and failure was responsible for 34% of all downtime events experienced. Therefore, the team recommends the Waites monitoring system hardware in order to monitor the conveyor systems and ensure the conveyors are maintained to prevent failure or damage during a sort. The hardware has the capability to measure temperatures and vibrations experienced by the equipment to alert workers if the equipment undergoes any abnormal conditions that may cause damage and failure to the system. With proper implementation of the hardware, the company has the potential to see approximately $2 million of cost savings per year.
Project Summary
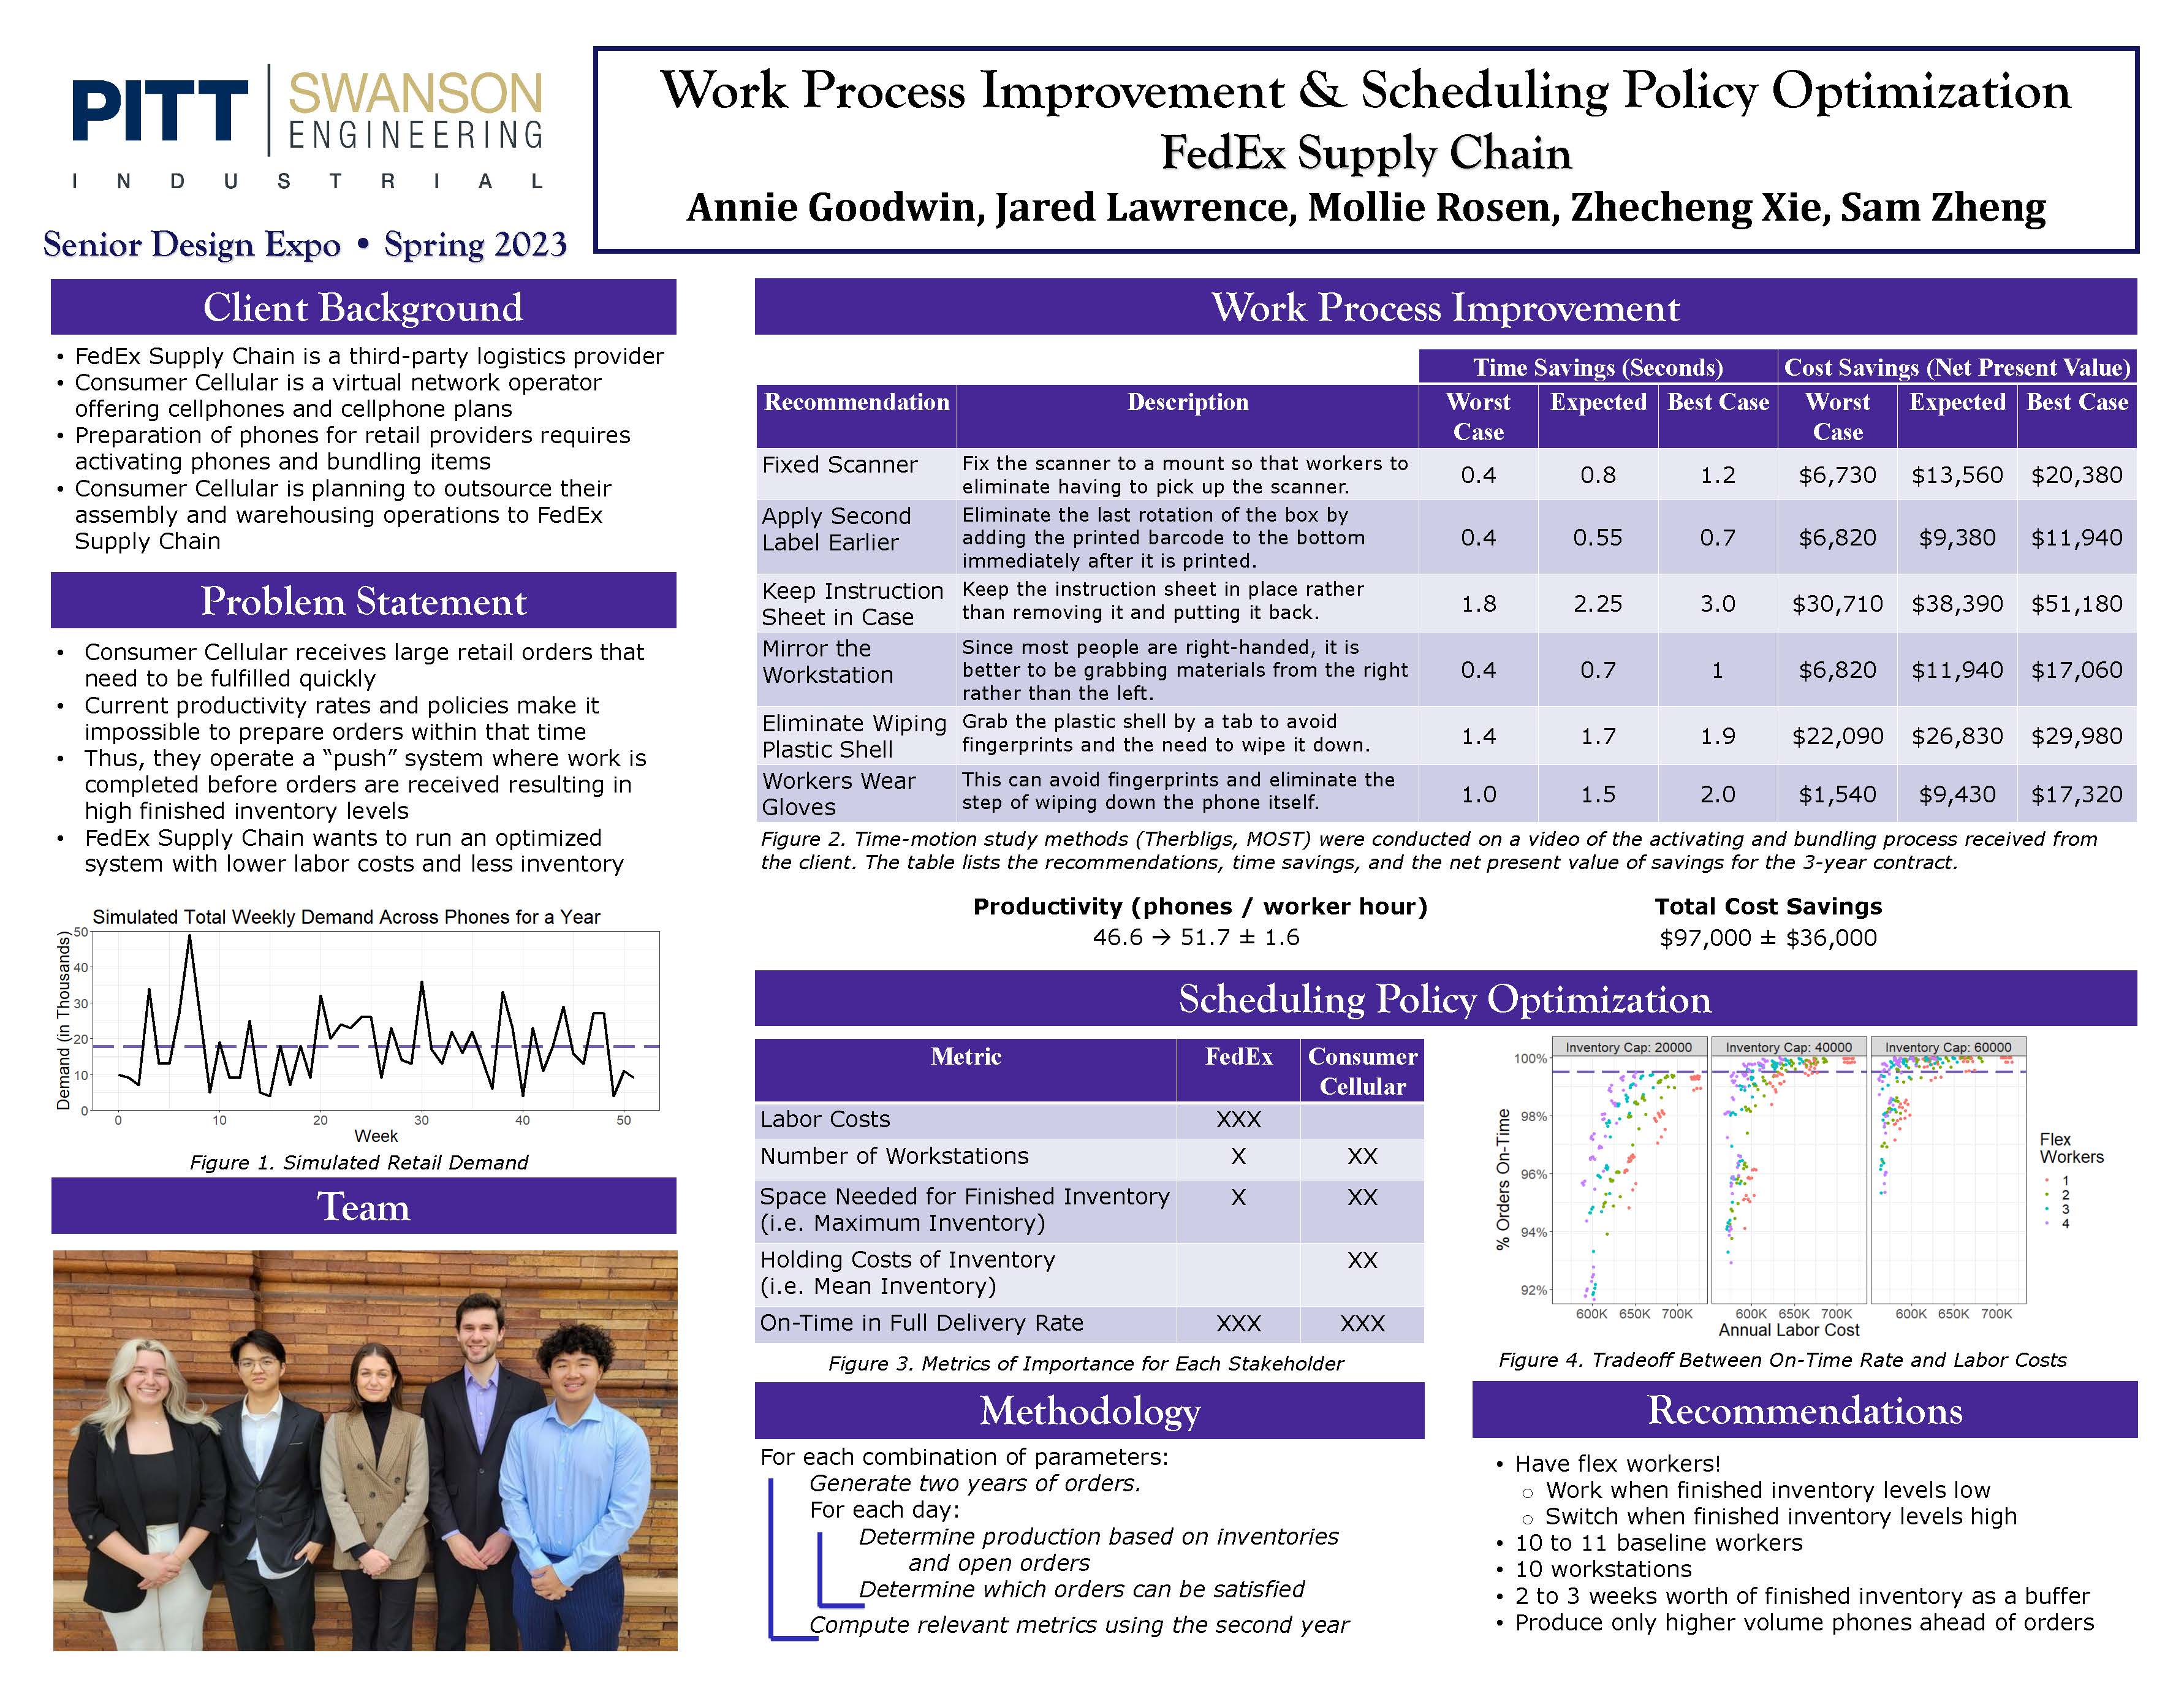
FedEx Supply Chain is a third-party logistics provider that will soon be taking over the Consumer Cellular warehouse where phones are activated with SIM cards, connected to the network, and bundled with information sheets. Orders to retail distributors are large with short fulfillment windows and as a result, they currently operate a “push” system in which work is completed before receiving orders. This leads to a large build-up of finished inventory. Further, the steps to activate and bundle the phones are not as efficient as they could be. To achieve FedEx Supply Chain’s goals of less labor costs and lower finished inventory levels, the team’s work is split into two segments: work process improvements and scheduling policy optimization. For improving work processes, the time-motion study methods of Therbligs and MOST were conducted on a video received from the client. These analyses resulted in the generation of six time-saving recommendations. All together, these recommendations improve the productivity rate of phone activation and bundling by 7.5% to 14.4% resulting in an estimated savings of about $97k over the next 3 years. Standard Operating Procedures were made to communicate these recommendations. For scheduling policy optimization, demand was simulated and various policies tested. These policies decide how much to produce in a day, which phones to produce, and which orders to satisfy. They include parameters such as number of workers, number of workstations, limits to overtime, and the number of cross-trained workers. In total, over 150k years of fulfilling orders were simulated. The greatest impact found was that having flexible cross-trained workers is critical to satisfying orders on-time with low total labor costs. Recommendations were also made about other parameters such as the amount of buffer needed and which phones can be prepared before receiving orders for them. Overall, our work saves on labor costs and will minimize finished inventory levels.
Project Summary
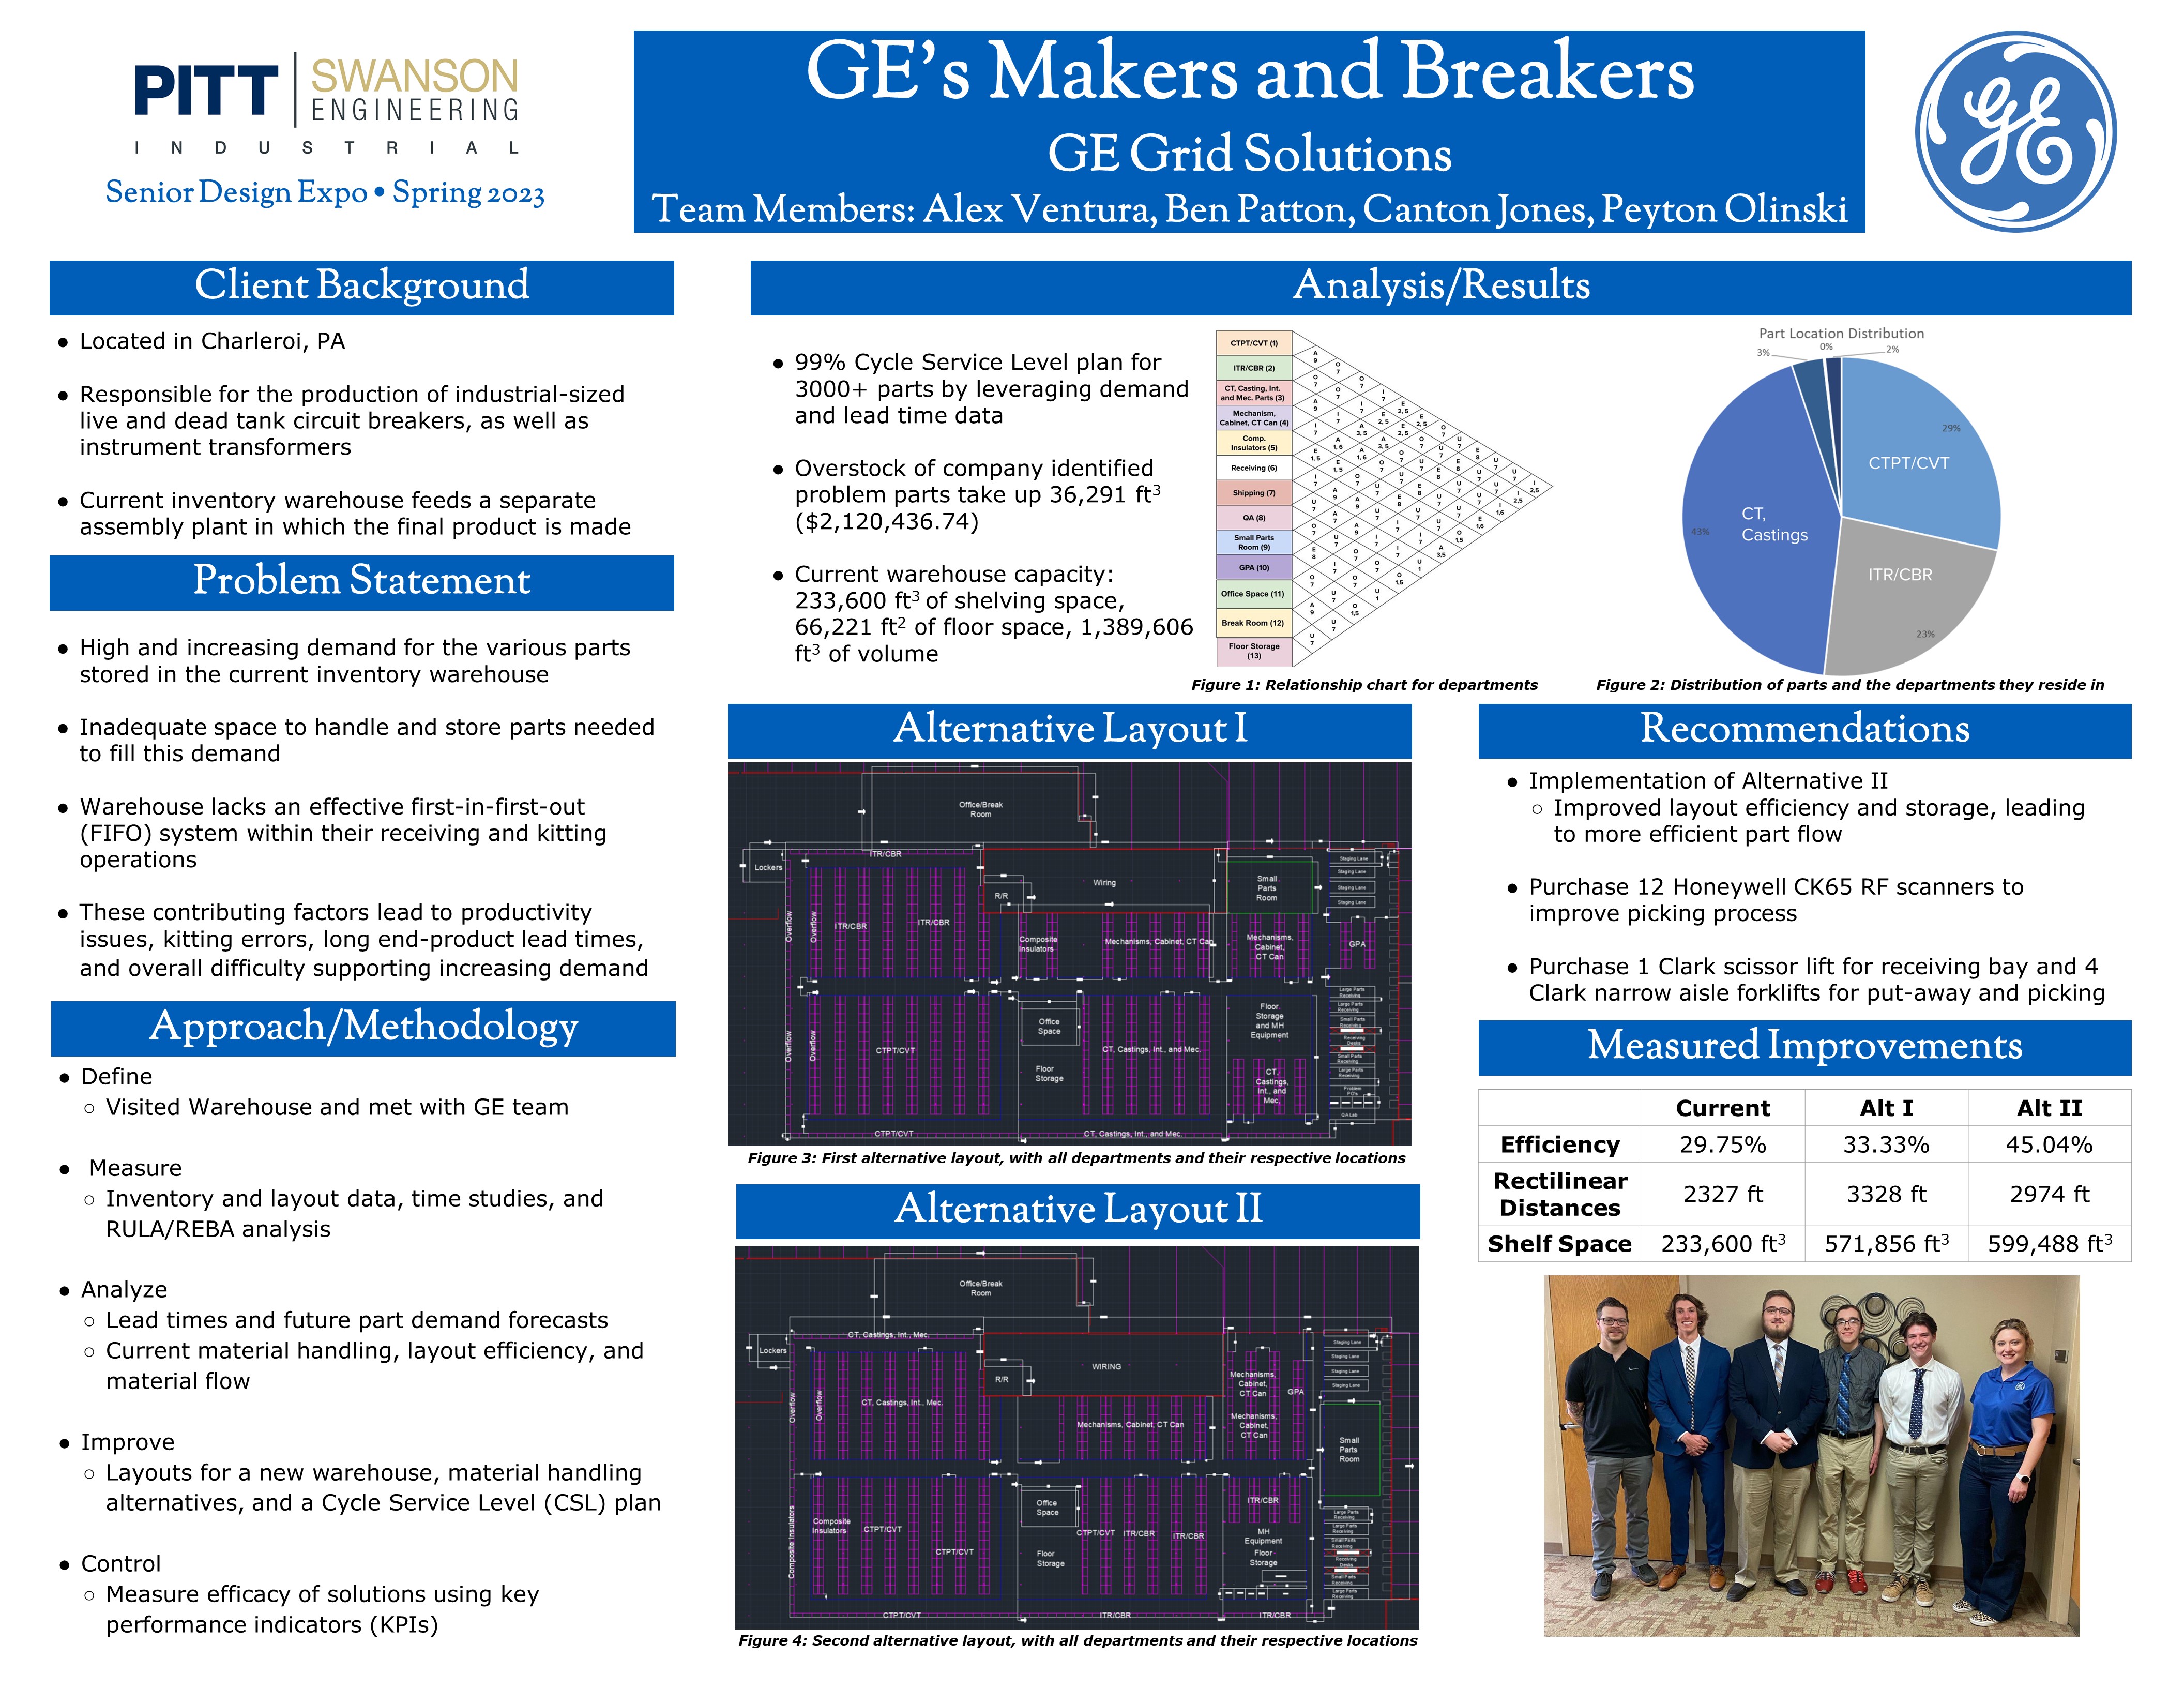
The goal of this project was to develop an optimal and feasible layout for General Electric’s new warehouse in Charleroi, PA. The team’s first step in the project was to visit the current warehouse site to better conceptualize and understand the inventory processes that take place throughout the warehouse.
Currently, there is a high volume of material coming into the current inventory warehouse, space is not optimized to handle increasing demand, and the current warehouse is not optimized for a first-in-first-out (FIFO) system. These issues lead to productivity issues, kitting errors, and difficulty supporting increasing demand.
Before alternative layouts could be developed, it was necessary to evaluate overstock, material volume, department locations and relationships, and the current warehouse capacity level.
Once these facets of the project were analyzed, alternative layouts for a new and larger warehouse were developed. These layouts include adequate shelving to support increasing demand. They also take into account the relationships between departments (such as the receiving bay and floor storage area).
The two alternative layouts were evaluated via rectilinear distances between departments and layout efficiency ratings. Ultimately, it was determined that Alternative 2 would best serve the needs of GE.
In addition to the development of a warehouse layout, visual management and material handling solutions were identified. Some of these solutions include a barcode-by-bay system, large overhead signs, the application of RF Scanners, and the acquisition of 1 Clark scissor lift and 4 Clark narrow aisle forklifts.
Project Summary
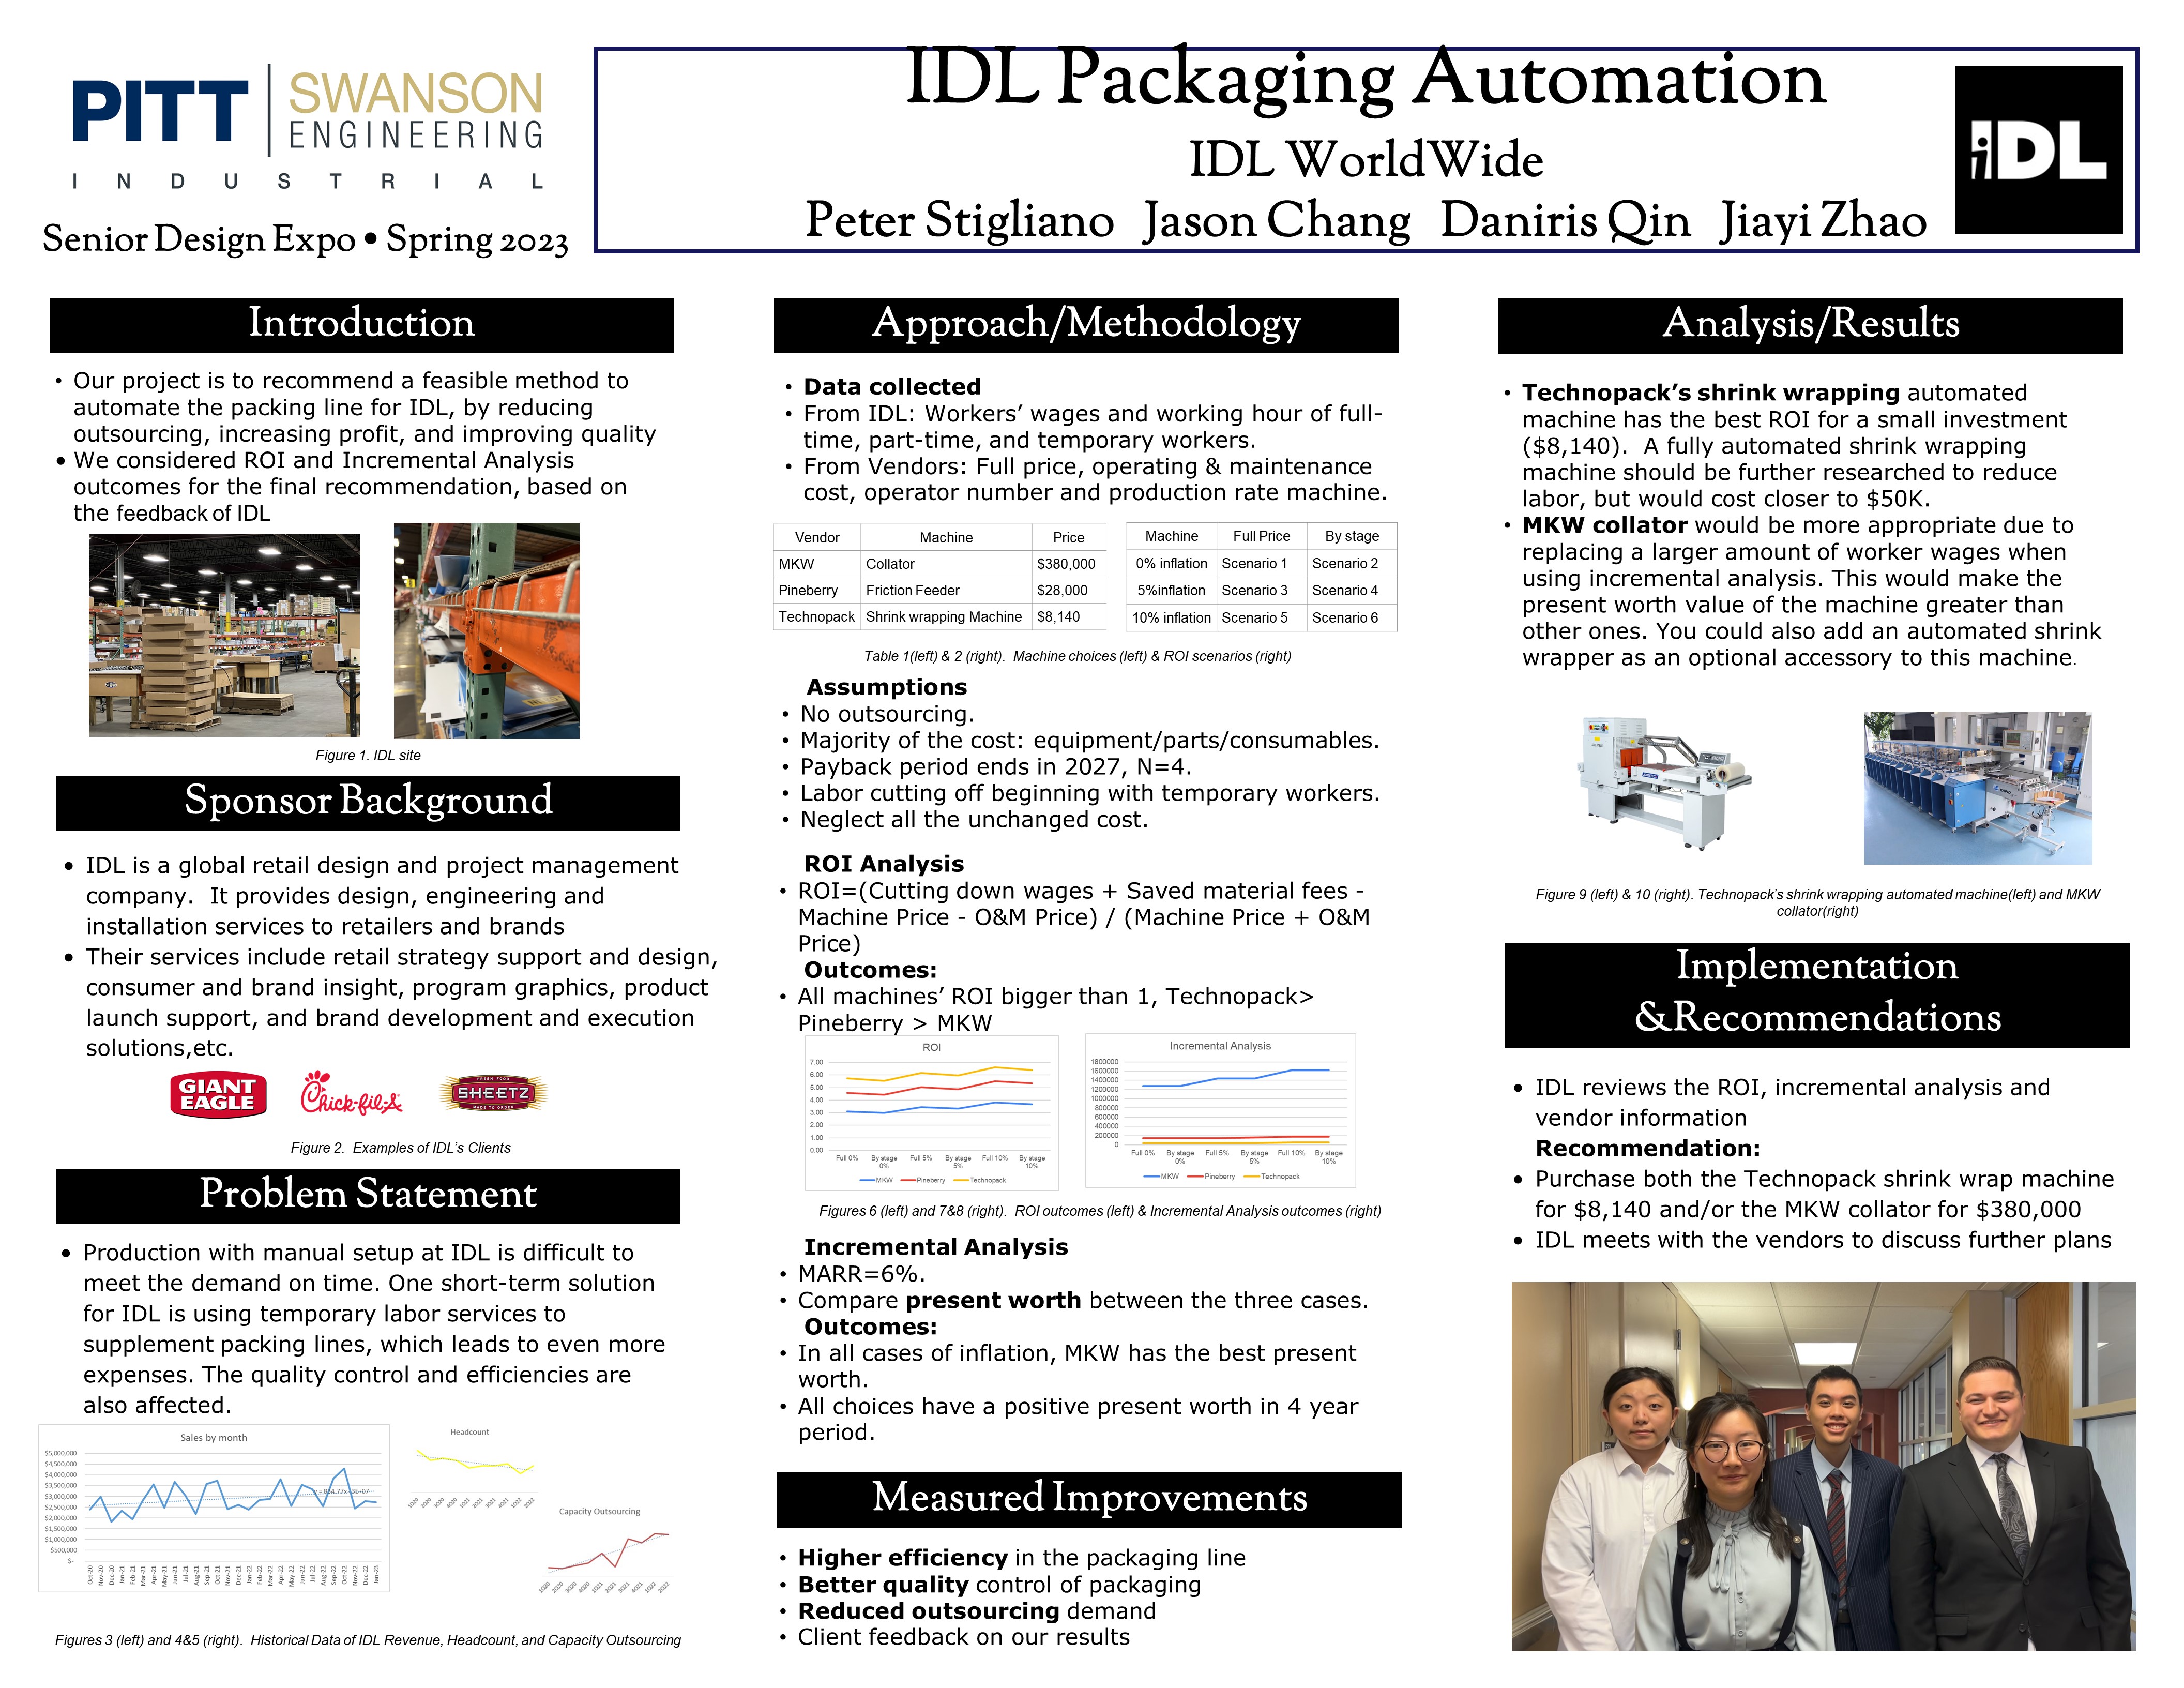
IDL is a global retail design and project management company that is part of Matthews International Corporation. It provides design, engineering, fabrication, fulfillment, and installation services to retailers and brands. Its services include retail strategy support and design, consumer and brand insight, retail re-imaging, concept shops and pop-up retail, custom store fixtures, permanent and temporary displays, program graphics, product launch support, and brand development and execution solutions. Our task was to help IDL improve its packaging labor source. Currently, the packing line utilizes operators to package signs without the use of automation. In peak seasons IDL currently does not have enough workers to keep up with demands and has to outsource temporary workers. This would lead to delays and efficiency due to inexperience on the line and packing process. It would also lead to more expenses for IDL. To help solve the IDL problem our team researched and reached out to vendors to see what types of automation can be used to help the manual packing line. This would lead to our biggest constraint as communicating with vendors can take days or even weeks. After we reached out and got information about the types of machines, for example, MKW collators, Technopacks shrink wraps, or Pineberry friction feeders we calculated the ROI and incremental analysis. IDL also wanted us to find the ROI for these machines and the incremental analysis was another source to help justify which machines to get. From our results of the ROI, the technopacks shrinkwrap had the best return on investment and for the incremental analysis, the MKW had the best present worth value. While IDL only wants to select one of these machines if possible we would recommend both of these to them.
Project Summary
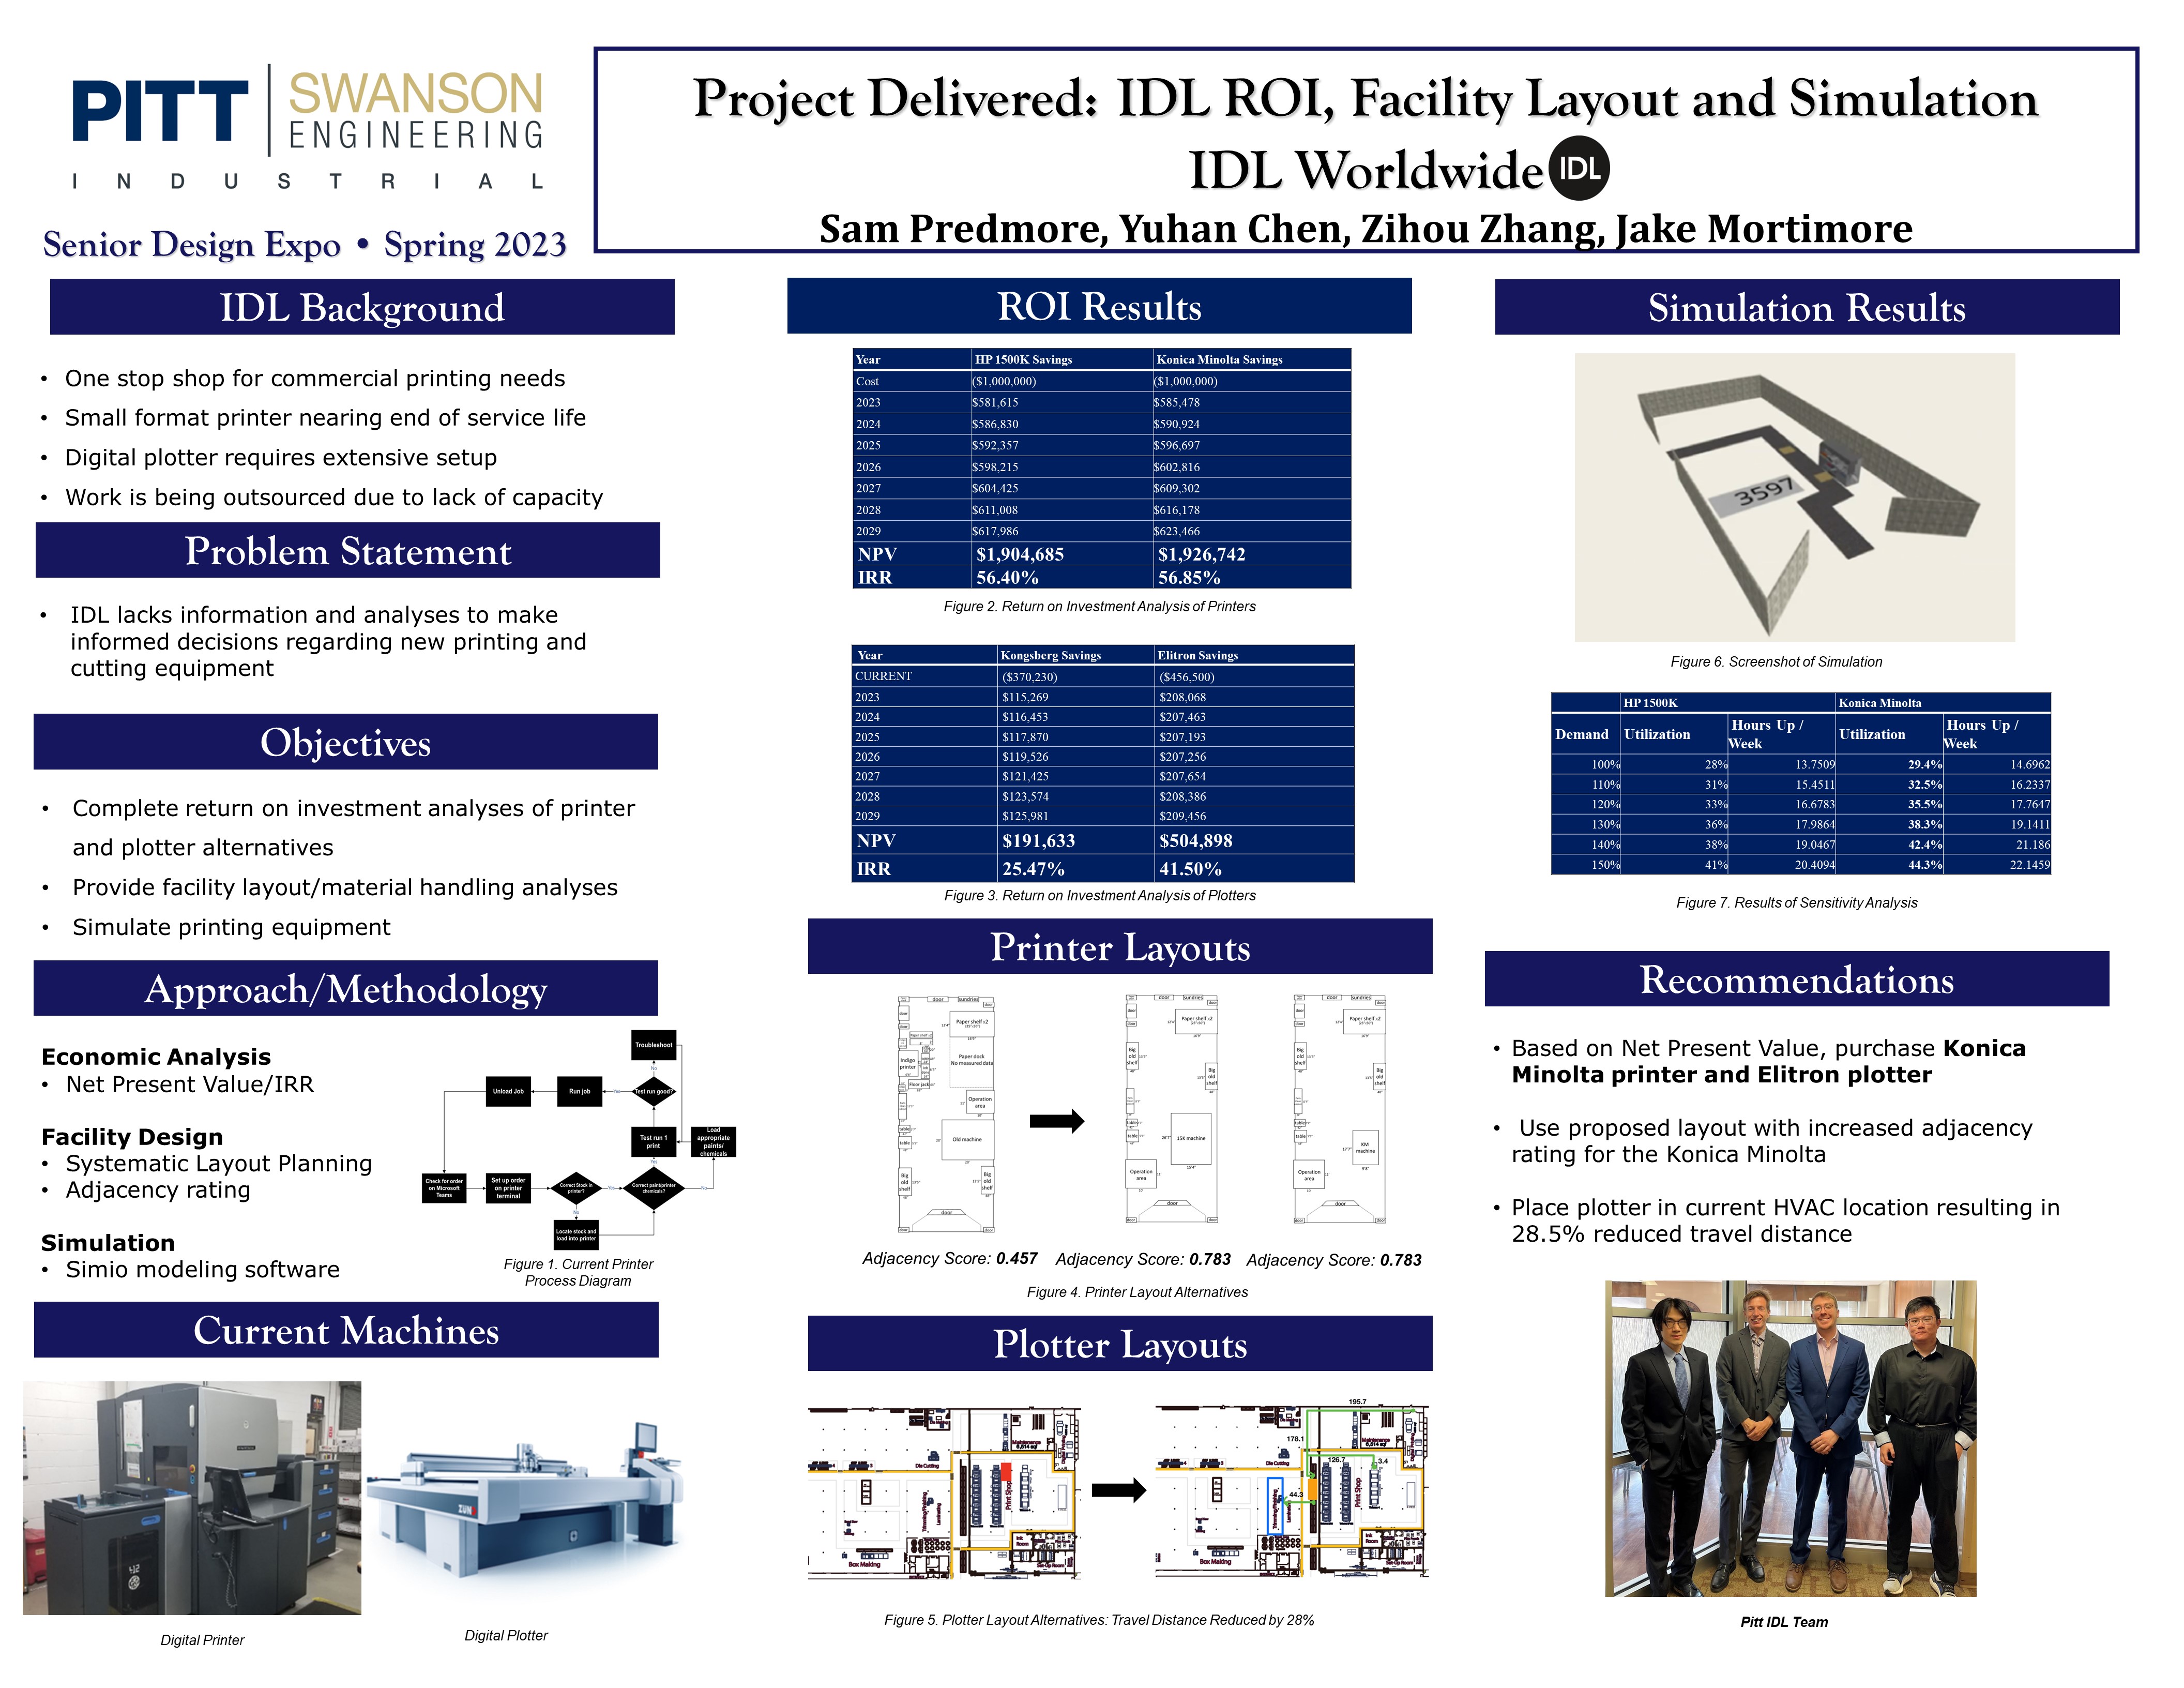
IDL Worldwide is an international printing company that services the needs of large commercial brands such as Chick-Fil-A, Sheetz, and Giant Eagle. IDL currently uses large and small format printers in their operation, as well as manual die cutters and digital cutters or plotters. The problem that IDL is facing is a lack of information and analyses required to make informed decisions regarding the purchase of new printing and cutting equipment. To solve this problem, the team completed return on investment analyses for new printing and cutting equipment, facility layout analyses on the proposed printing area and new locations for a plotting machine, and constructed a simulation model, to perform a sensitivity analysis, on the new printing equipment.
Upon completion of the printer and plotter ROI analysis, it was determined that the Konica Minolta (KM) printer yielded the highest return on investment with an IRR of 57% and the Elitron plotter yielded an IRR of 42%. The group then constructed new layouts with the KM printer, increasing adjacency ratings from 45% to 78%. New plotter locations were also analyzed, and travel distance was ultimately reduced by 28%. Finally, upon completing the sensitivity analysis on the KM printer using Simio modeling software, it was determined that, even with a 50% increase in demand, the KM printer would only reach a utilization rate of 44%.
Our final recommendations to IDL included purchasing the Konica Minolta printer and Elitron plotter. In addition to buying these machines, IDL should adopt new layouts that increase adjacency rating and decrease travel distance. IDL will be able to meet demand and will have ample room for growth in a market that is expected to grow by 6% in the next year.
Project Summary
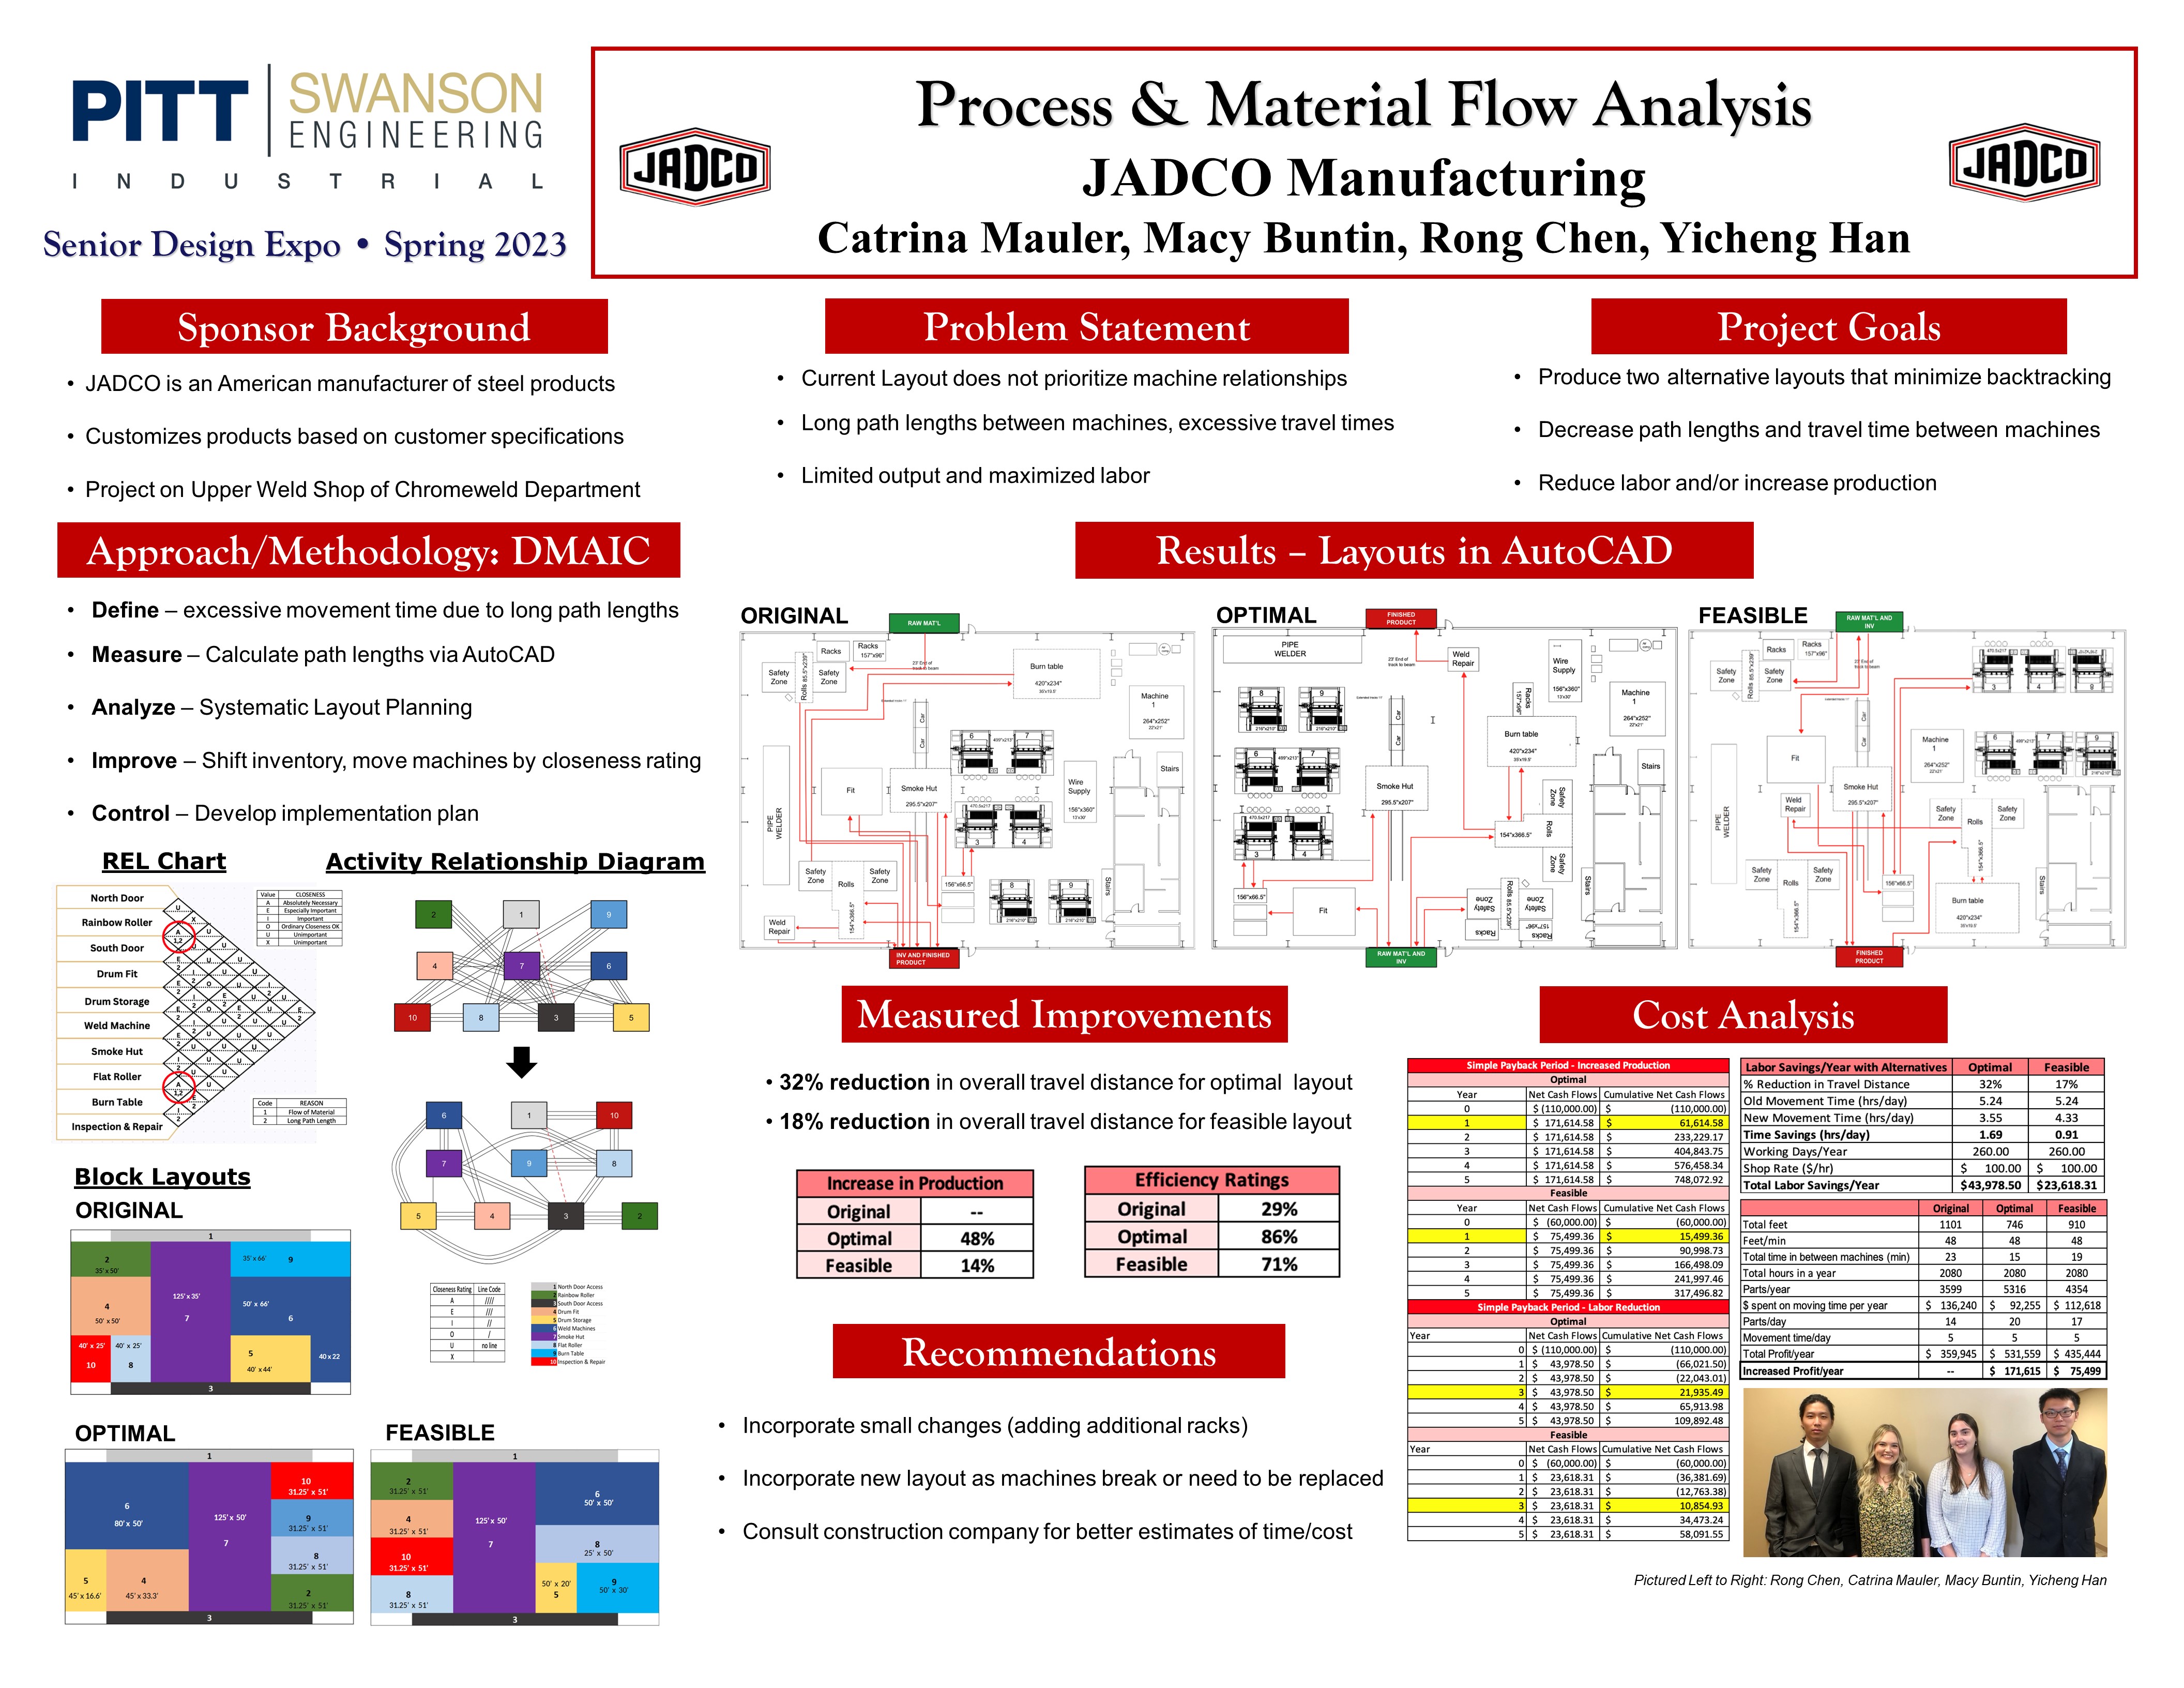
JADCO is a family-owned manufacturer of supreme quality impact and abrasion resistant steel products. Their manufacturing facility is located in Harmony, PA and was the main point of focus for this project. The current layout of the Upper Weld Shop of the Chromeweld Department was designed without prioritizing machine relationships. This created long path lengths and excessive non-value added time in the steel production process. Our project goal was to produce two alternative layouts that have a direct process and material flowpath. This in turn would minimize backtracking during production, decrease travel distance, and reduce costs.
Our two alternative layouts consisted of an optimal and feasible layout, and both were visualized using AutoCAD. The optimal layout was determined using systematic layout planning and the DMAIC approach to problem solving. The feasible layout was determined based on client feedback, and prioritized minimizing machine movement. Both layouts had high efficiency ratings as well as a substantial decrease in path lengths. Furthermore, an in-depth cost analysis of each layout was performed and presented to JADCO. Labor savings, potential increases in revenue, and simple payback periods were calculated in order to justify implementing our suggested layouts. In addition, the potential increase in production in terms of parts per day was calculated for each layout. We concluded that our suggested layouts were favorable based on the results of this analysis.
Regarding a long term implementation plan, we recommended that JADCO look to incorporate small changes (e.g. adding additional storage), and consider adjusting the layout as machines naturally need to be replaced. We also recommended that JADCO consult a construction company for better estimates of the time/cost of implementation.
Project Summary
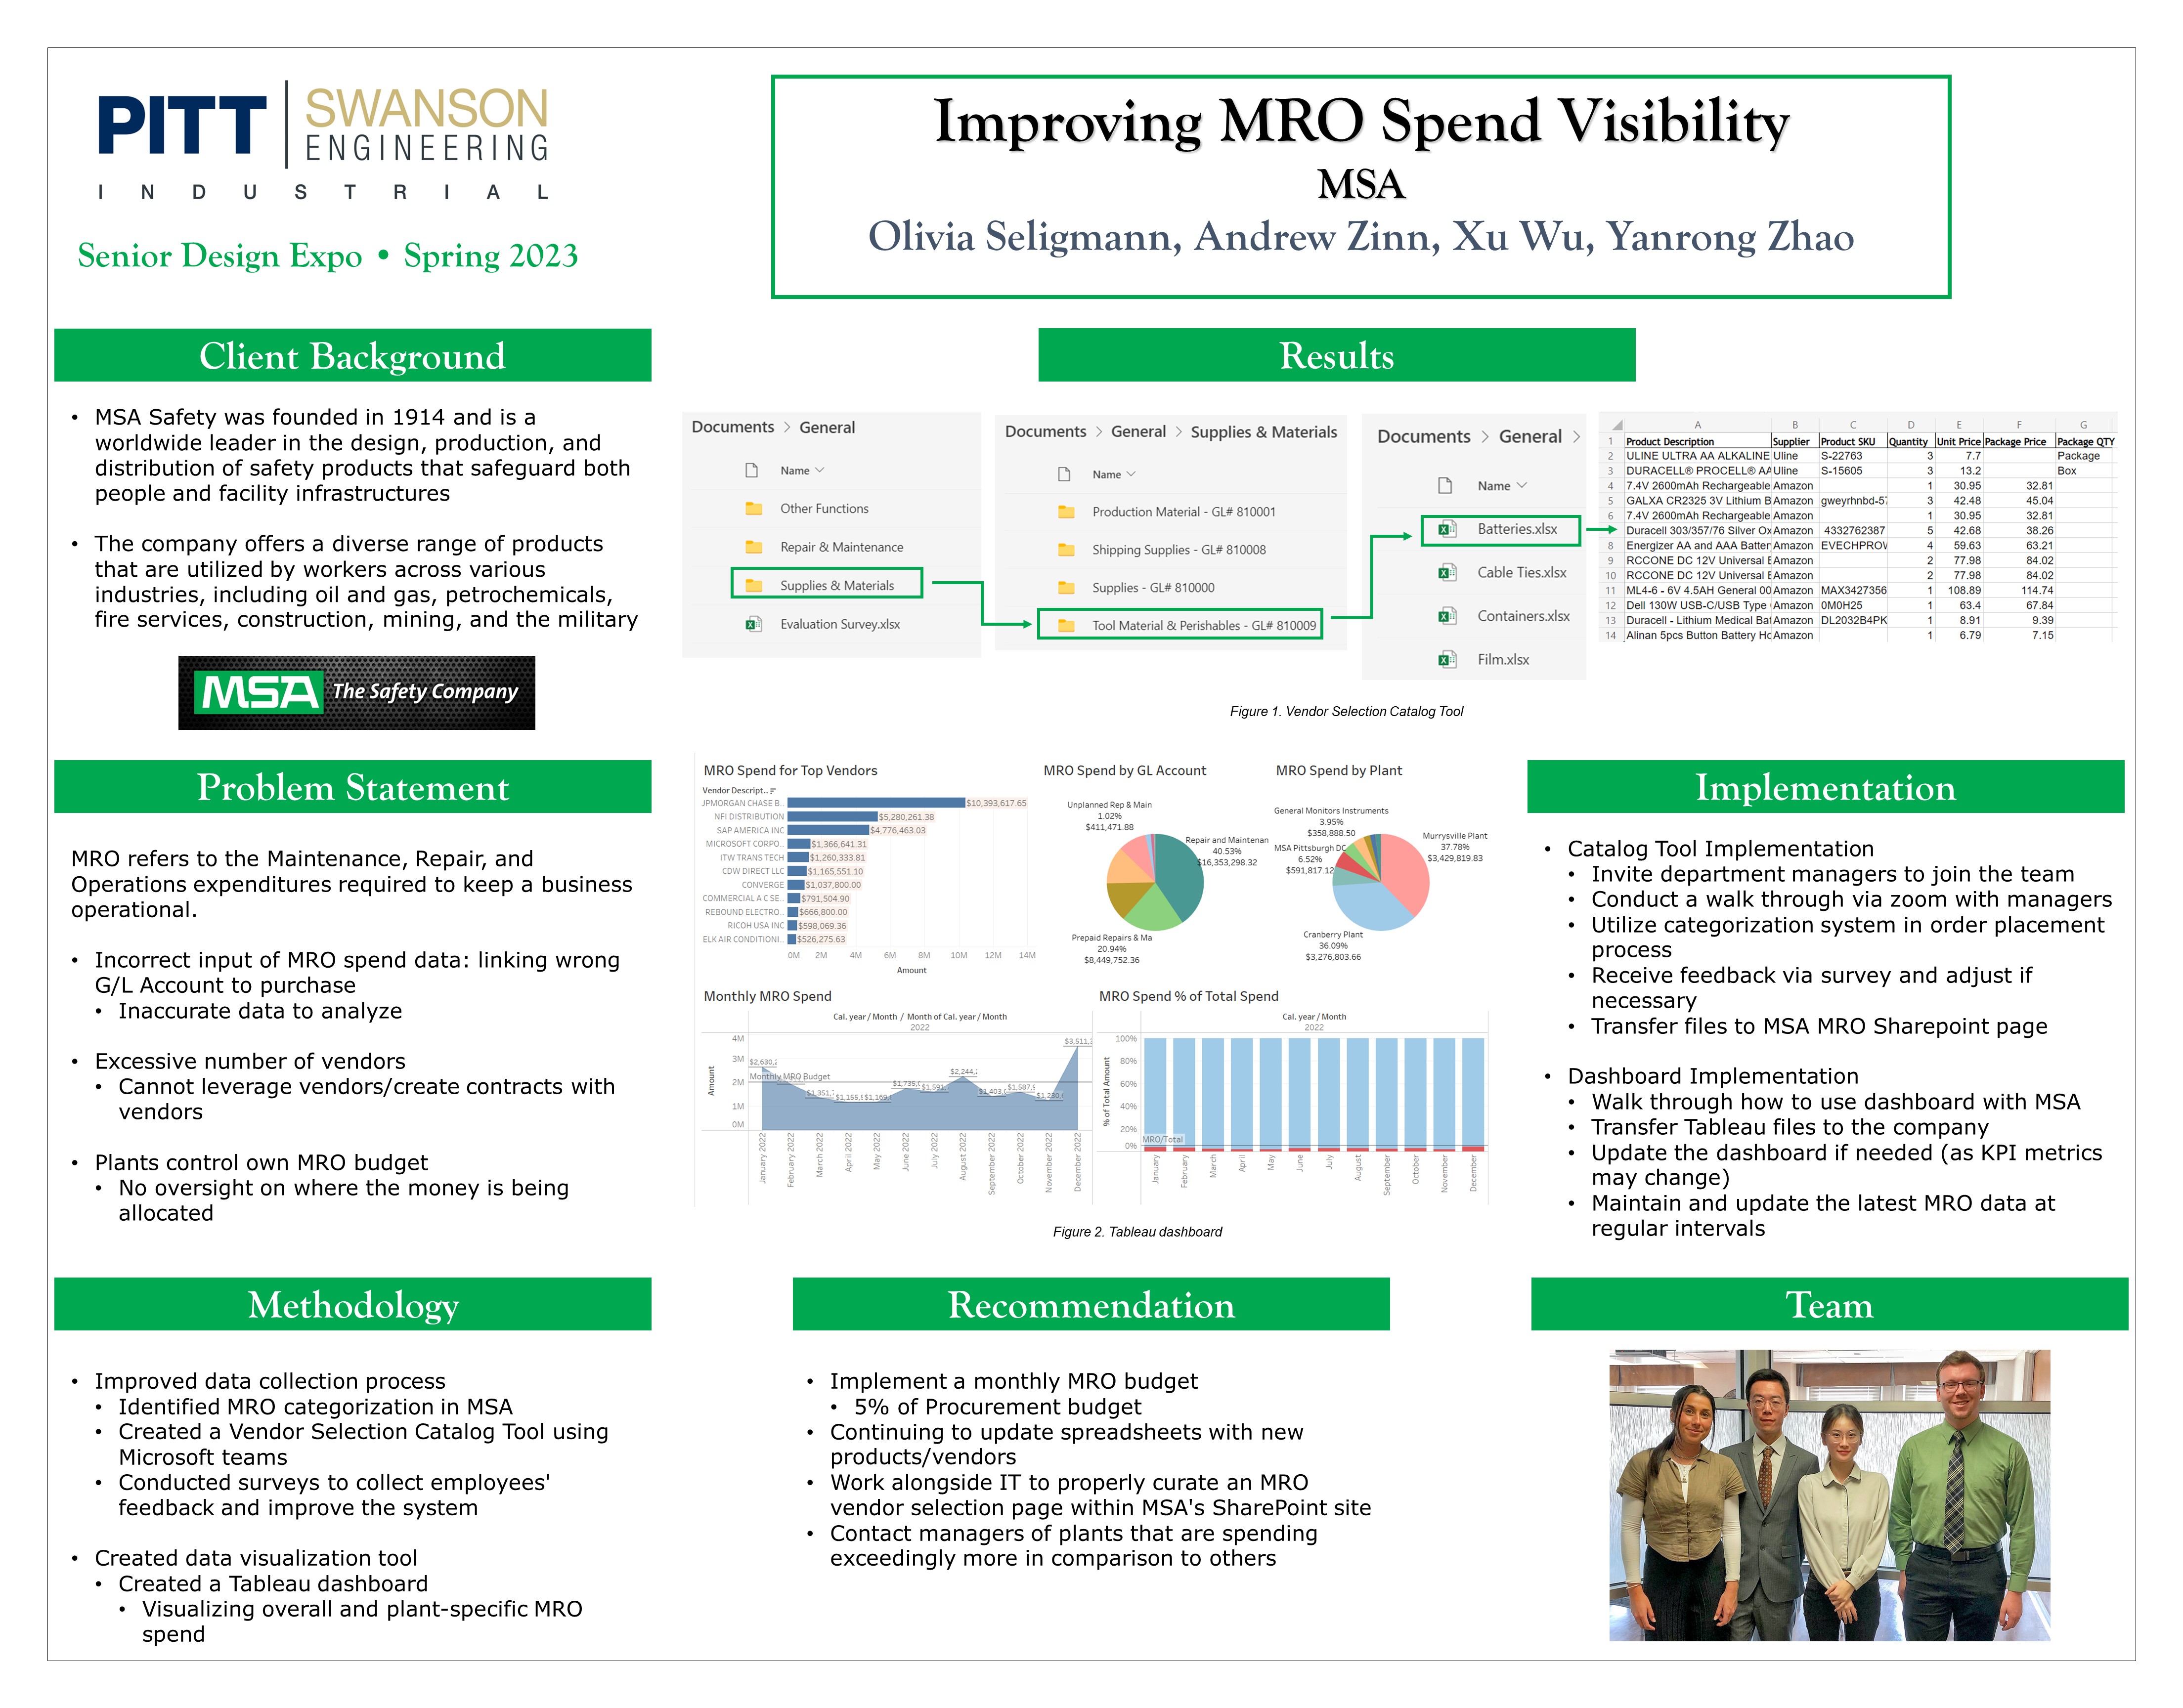
MSA develops, manufactures, and supplies safety products that protect people and facility infrastructure internationally. Within recent years there has been limited visibility and incorrect categorization of MRO spending. MRO stands for maintenance, repair, and operations thus, items defined as such are not a part of the finished product but are used during the production process. Systematically at MSA, an employee purchases a product and then links said purchase to a G/L Account to categorize their purchase. Employees end up linking purchases to the wrong account if they input the incorrect number, which is a common occurrence. The result is incorrect spend data leading to difficulties in leveraging vendors, obtaining spending overviews, and budgeting. To mitigate these issues, we came up with a two-part solution plan. The first part looks to improve the spend data collection process through a vendor selection catalog system on Microsoft Teams, the platform MSA uses company-wide. The system is comprised of past purchases from MSA’s preferred vendors such as Amazon, Fastenal, and Uline. The purchases are sorted into G/L Accounts folders from three broad categories Repair & Maintenance, Supplies & Materials, and Other Functions, and put on spreadsheets. Through this method, MSA can standardize their MRO purchase process. The second part was creating a Tableau dashboard that displayed MRO spend by plant G/L Account, and overall monthly spend each with indicated budgets. We recommend that MSA use a monthly MRO budget that is five percent of their total procurement budget. The company should also continuously update the spreadsheets of purchase with new products and vendors, as well as contact managers of plants that are superseding the budgets of other plants.
Project Summary
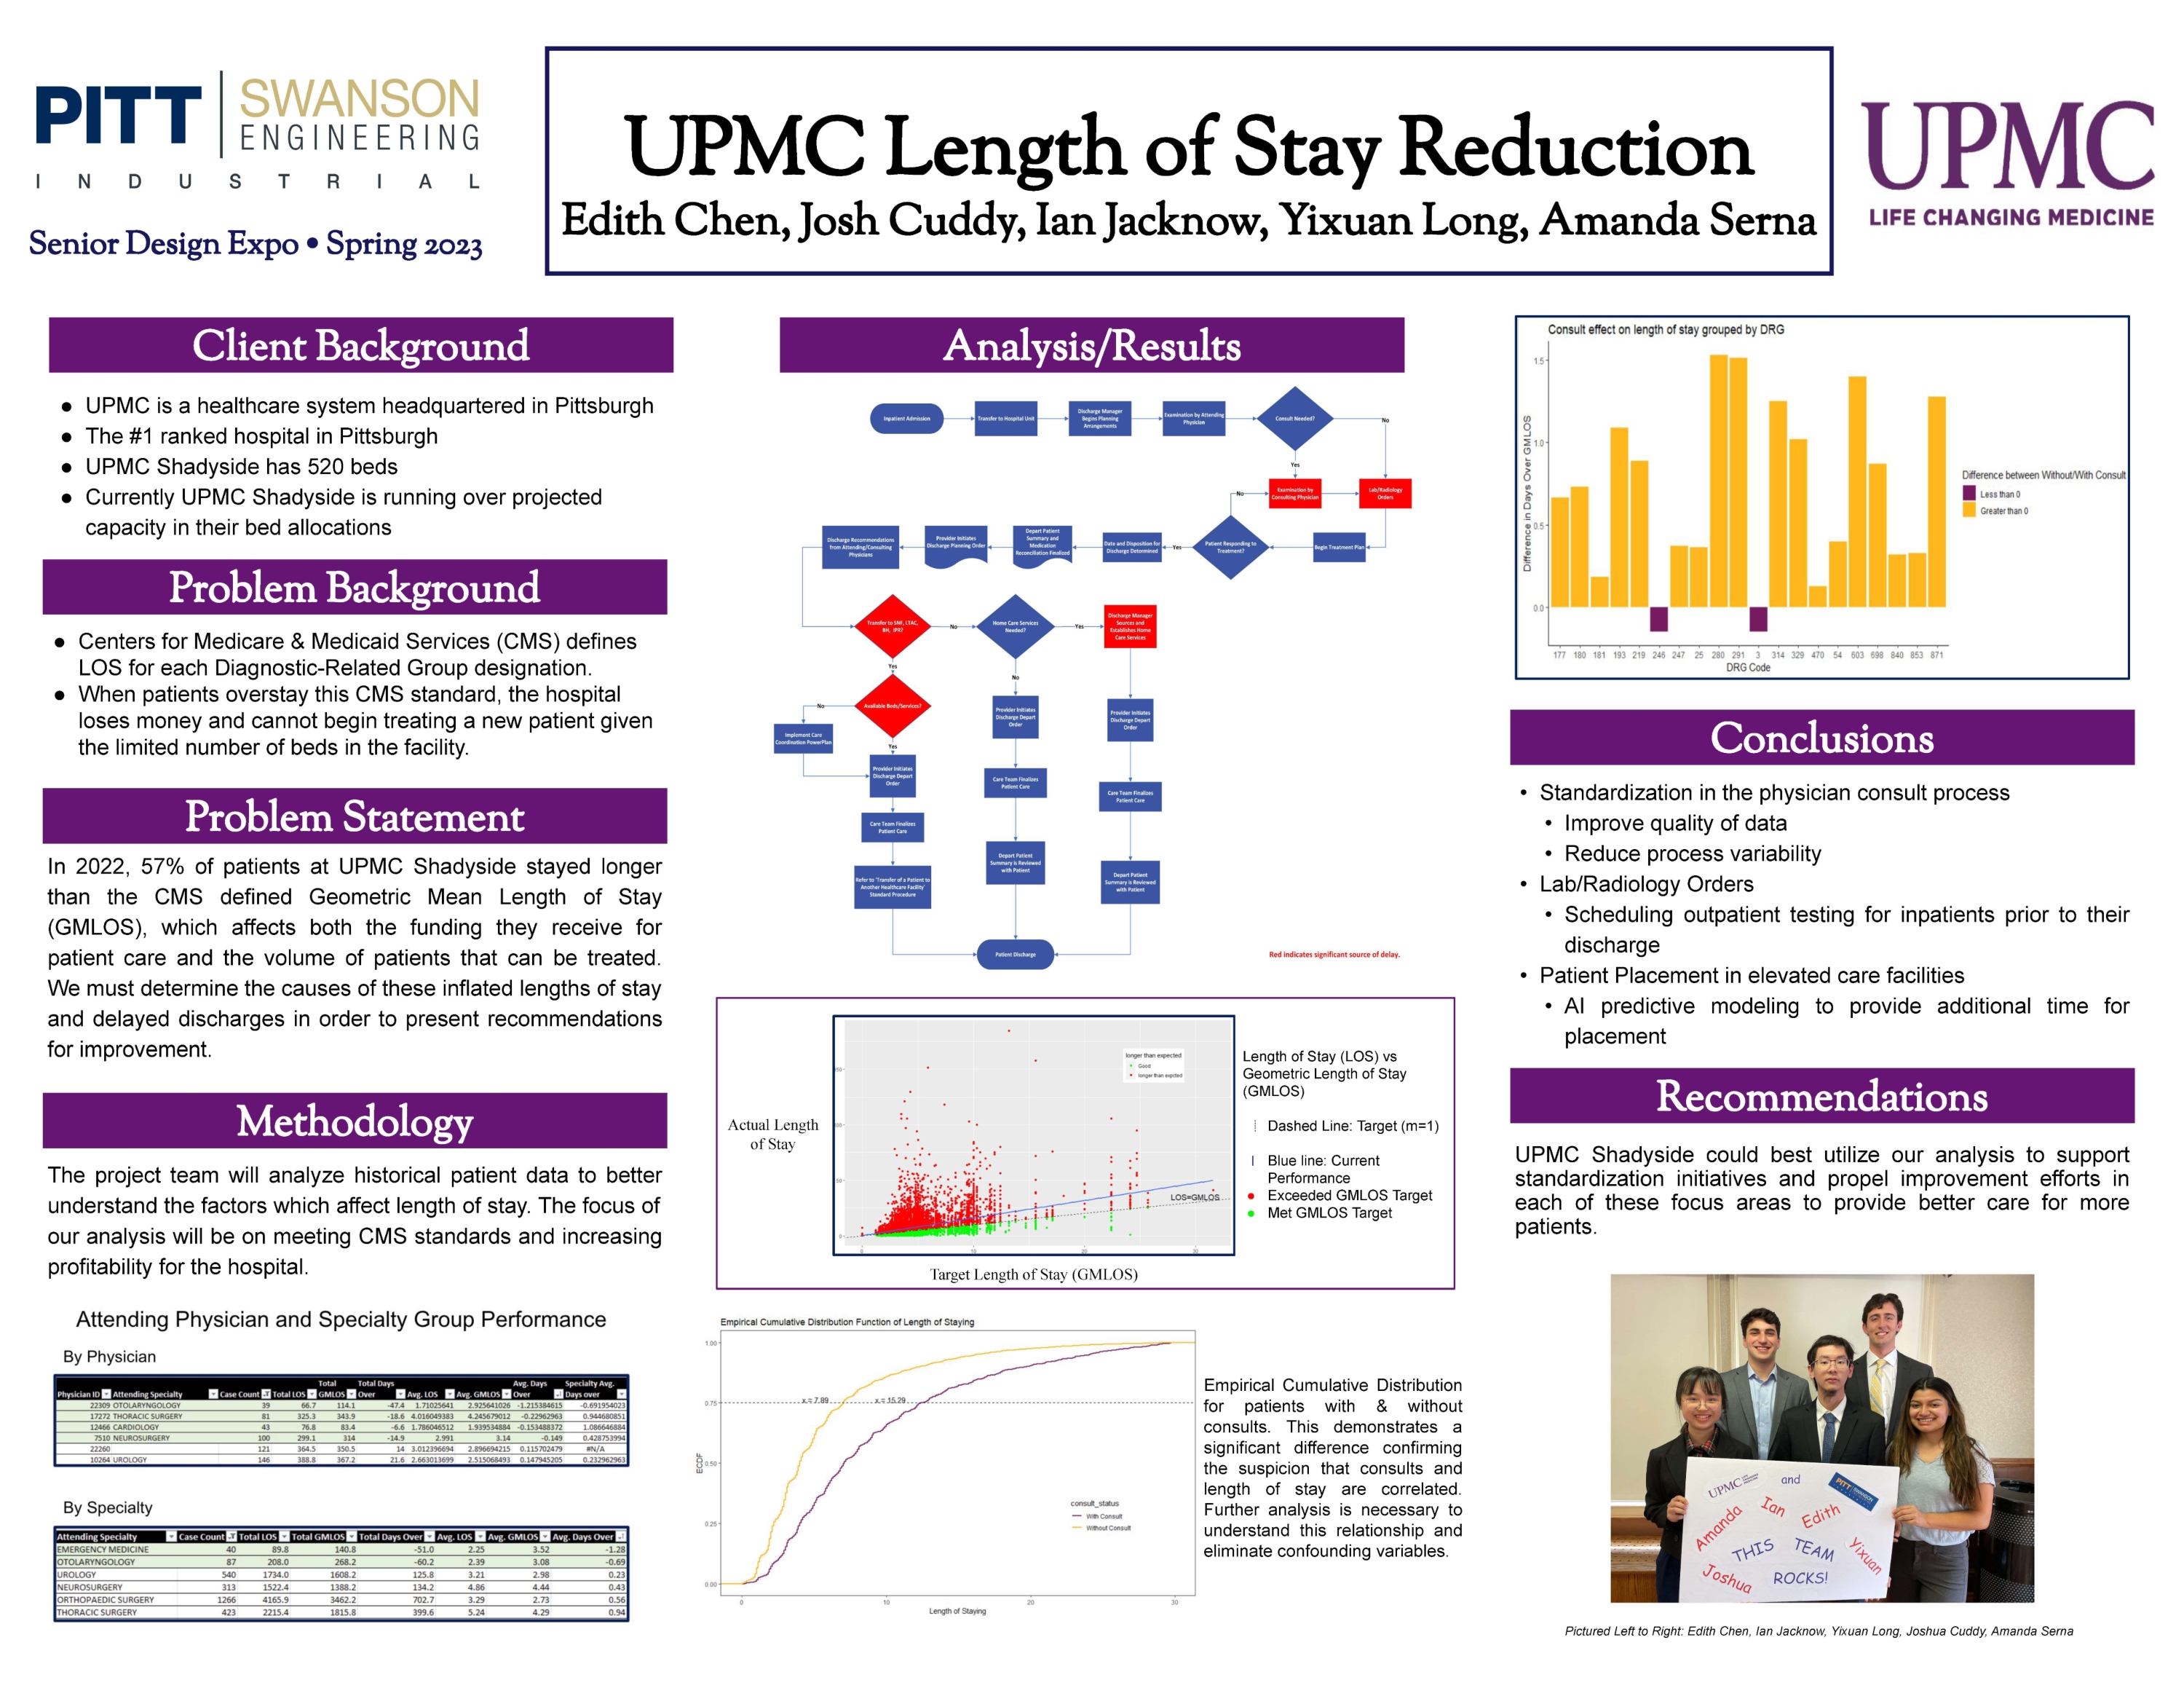
UPMC Shadyside is experiencing longer than expected inpatient hospital stays that affect the profitability of the hospital, the quality of care for patients, and the number of patients that they can treat. Centers for Medicare & Medicaid Services (CMS) calculates the geometric mean length of stay (GMLOS) for each Diagnostic-Related Group (DRG) designation. When patients overstay this CMS standard, the hospital is not only unable to bill payers but also cannot begin treating a new patient due to limited bed capacity. In 2022, 57% of patients at UPMC Shadyside stayed longer than the expected GMLOS for their specific diagnosis. Our project goal was to locate areas causing the most substantial impact to inpatient discharge delay, uncover reasons behind the process bottlenecks, give recommendations, and configure methods for continuous improvement.
In order to address this problem, the project team interviewed UPMC staff familiar with the process and analyzed historical patient data to better understand the factors which affect the length of stay. One such factor, we hypothesized, was consulting physician turnaround times.
Mainly the effect of consults on a patient's length of stay was examined. The team examined patient data for cases with and without consults and grouped the cases by DRG to eliminate case complexity as a possible confounding variable. The analysis showed a difference of almost 1.5 patient days in some DRG categories and indicated there is likely a relationship worth further investigation.
Additionally, the team developed a machine learning prediction model using data available early in a patient’s stay to better determine when a patient’s discharge should be planned. This was intended as a proof of concept to show how new techniques, including machine learning, could be applied to the healthcare industry.
Based on qualitative observations by members of the UPMC staff embedded in the process, the team made recommendations to standardize practices in laboratory/radiology orders and elevated care facility placement. By implementing our recommendations, we estimate a reduction in patients’ length of stay, an increase in the volume of patients seen, and greater overall hospital profitability.
Fall 2022 Projects
Project Summary
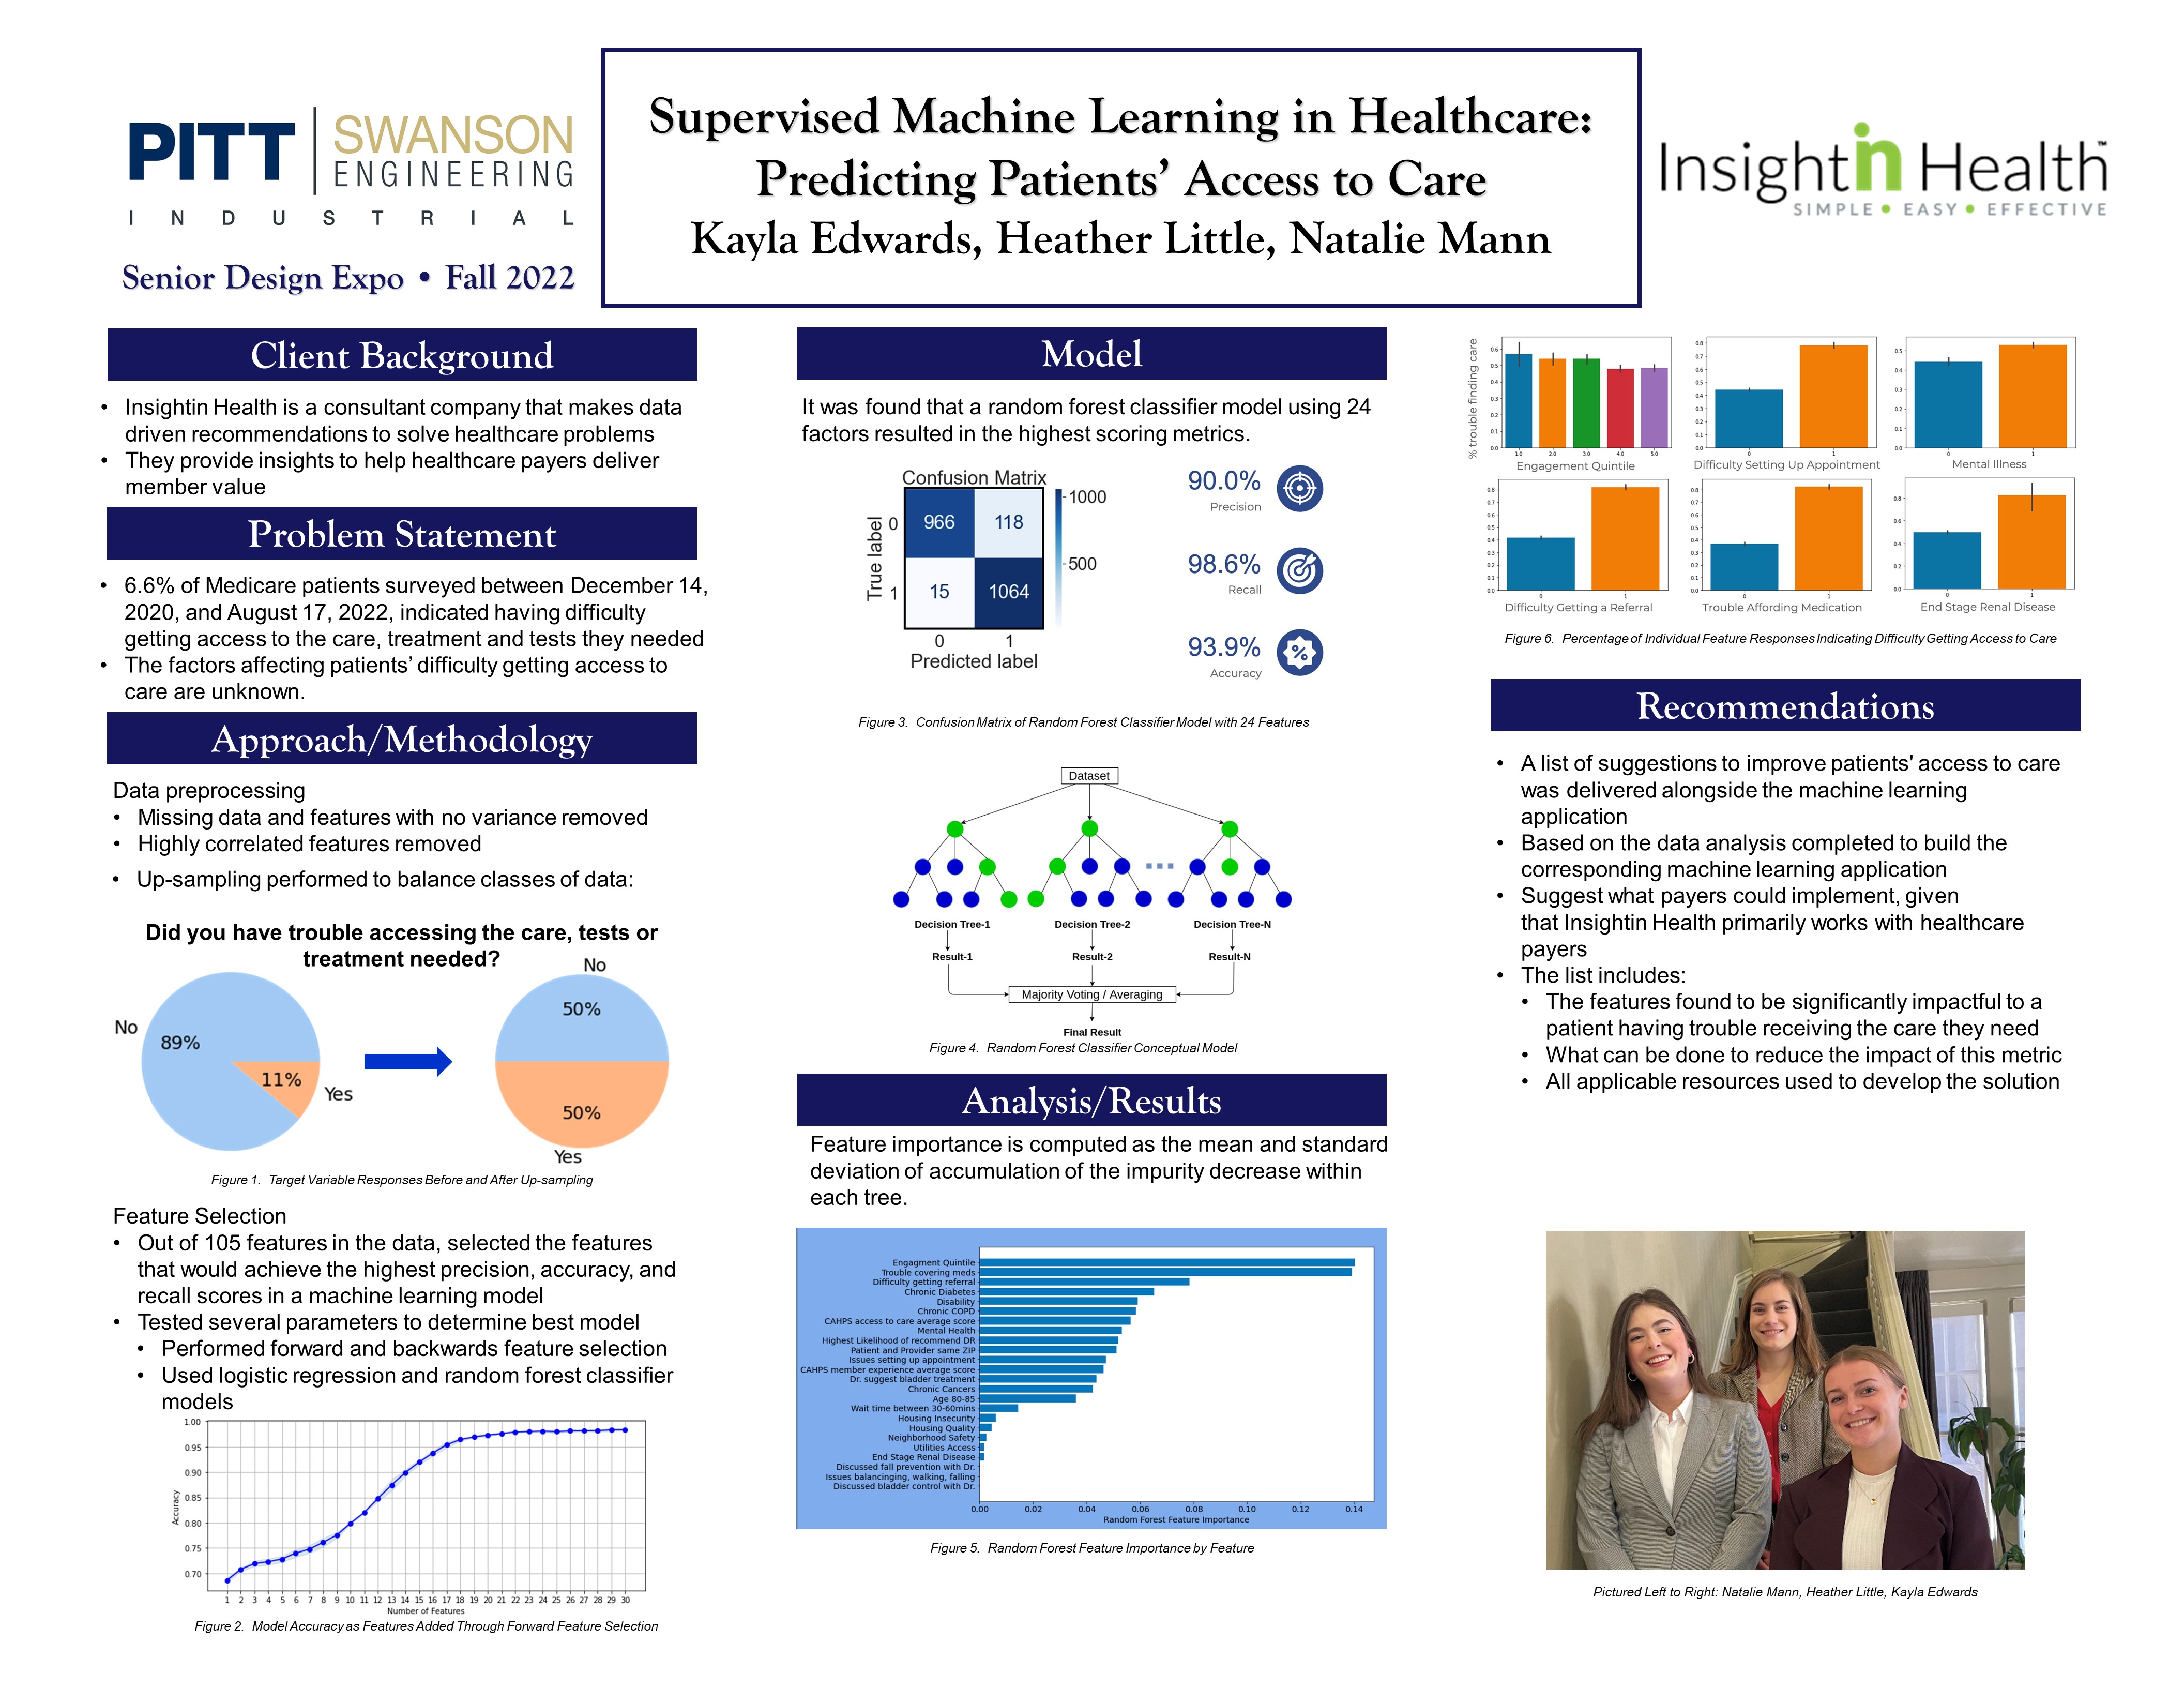
Insightin Health is a healthcare consultant company that makes data-driven recommendations to solve healthcare challenges. These recommendations are typically given to healthcare payers to deliver member value. By surveying Medicare patients from December 14, 2020, through August 17, 2022, Insightin Health identified that 6.6% of respondents indicated it was difficult to get any care, tests, or treatment that they needed, and the factors that affect patients’ access to care prior to this project were unknown. The goals of this project were to identify what combinations of factors are most influential in a patient having access to care, develop a machine learning application using these factors, and develop a list of recommendations to improve patients’ access to the treatment, testing, and care they need. To identify the most impactful factors in patients’ access to care, the student team tested several combinations of parameters in a feature selection greedy algorithm. After doing so, the team found that using forward feature selection and random forest classifier as the estimator resulted in the best measures of accuracy, precision, and recall. Twenty-four features selected through this method were included in a final supervised machine learning model that reached 93.9% accuracy, 90.0% precision, and 98.6% recall. After identifying the impactful features, the team created a document listing data-driven and research-based recommendations for improving patients’ access to care. The list includes the features found to be significantly impactful to a patient having trouble receiving the care they need, what can be done to reduce the impact of these metrics, and any applicable resources used to develop the solutions. The document of recommendations and machine learning model have been shared with Insightin Health to assist their team in addressing the factors that impact Medicare patients’ access to care.
Project Summary
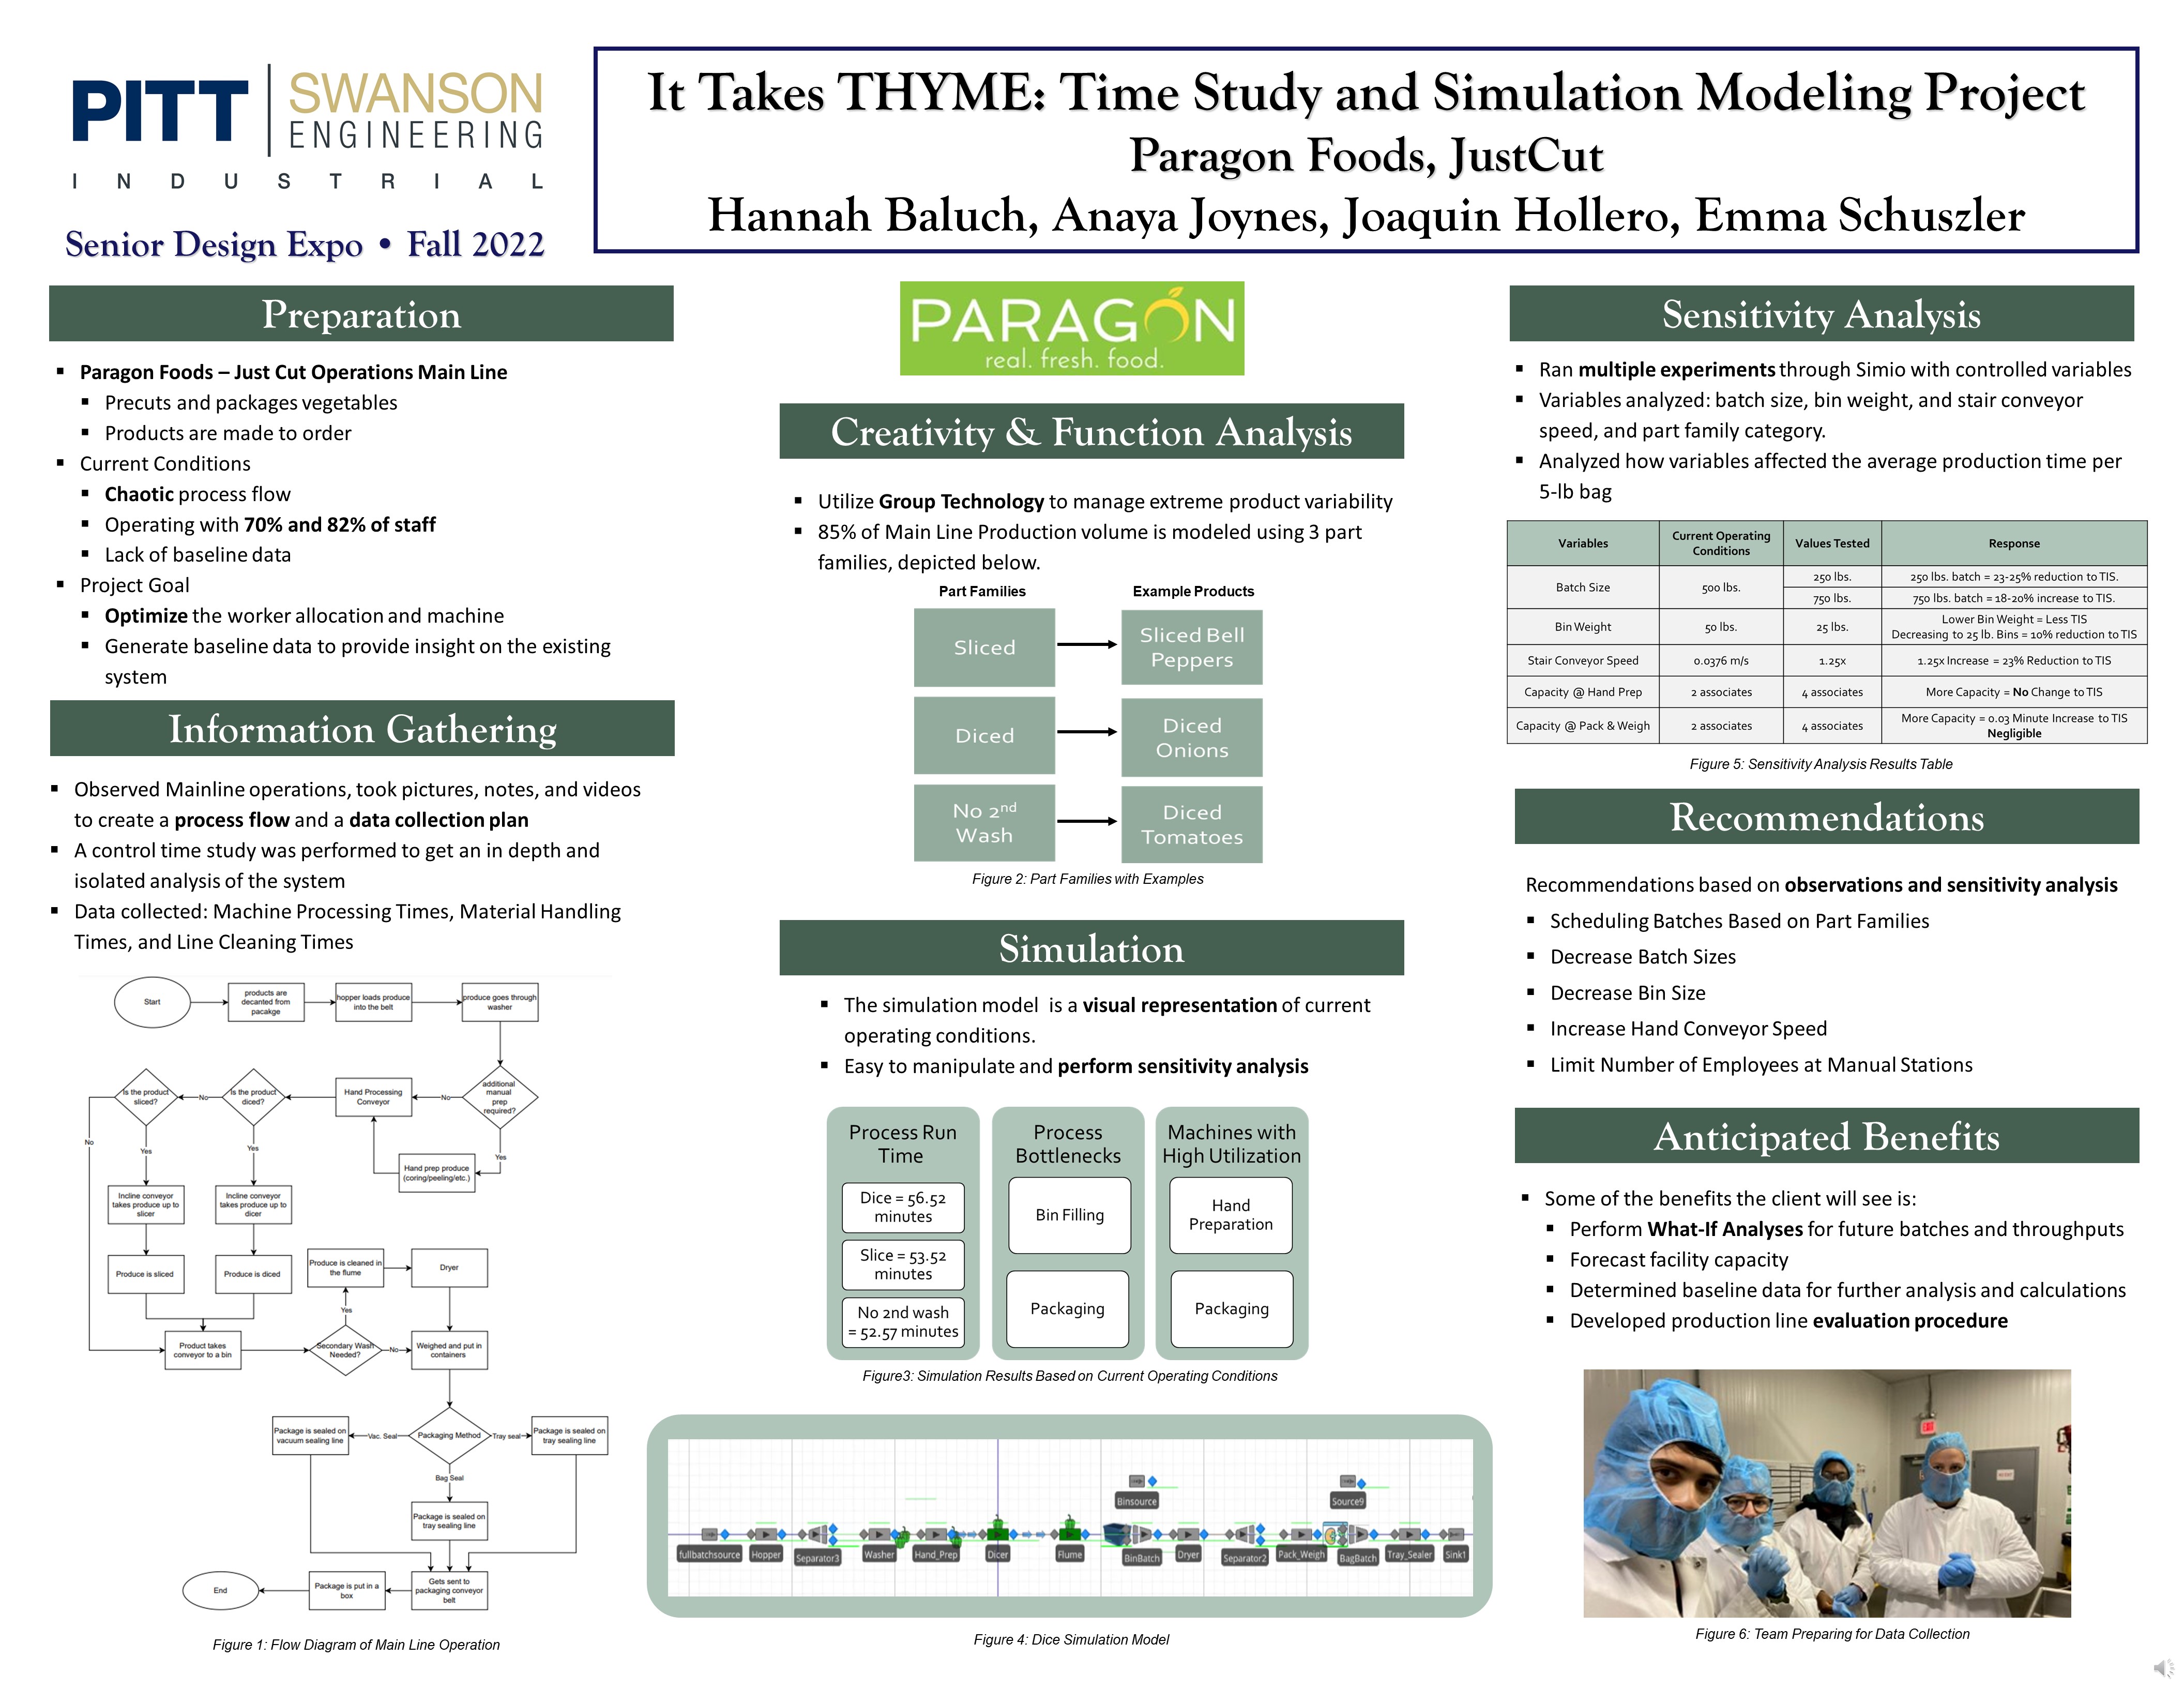
Paragon Foods is a rapidly growing company that prepares fresh produce for restaurants, universities, and hospitals. At Paragon Foods in the JustCut operations, the Main Line for production produces made-to-order precut and prepackaged vegetables. The Main Line can produce a wide variety of final products; however, the current process is chaotic due to line flexibility, product variability and lack of staffing. The main goals of this project were to establish baseline data, create a simulation of the process in SIMIO, and combine these two resources in order to analyze the process and optimize worker allocation on the Main Line. Controlled time studies were conducted to obtain the appropriate data needed to construct an accurate simulation. In order to manage product variability, group technology was utilized to develop three major part families that account for eighty-five percent of the total production volume. Simulations were built to model each of the part families for them to be analyzed. Using the simulation, a sensitivity analysis was performed to see how the models would react to variable changes. Looking at the results of the experiments, it was determined that certain variables had much larger impacts on the system when they were adjusted in the simulation. Therefore, it was recommended that these variables be increased or decreased appropriately. It was also recommended that scheduling is done so that vegetables that are in the same part family go through the system in sequence with one another.
Project Summary
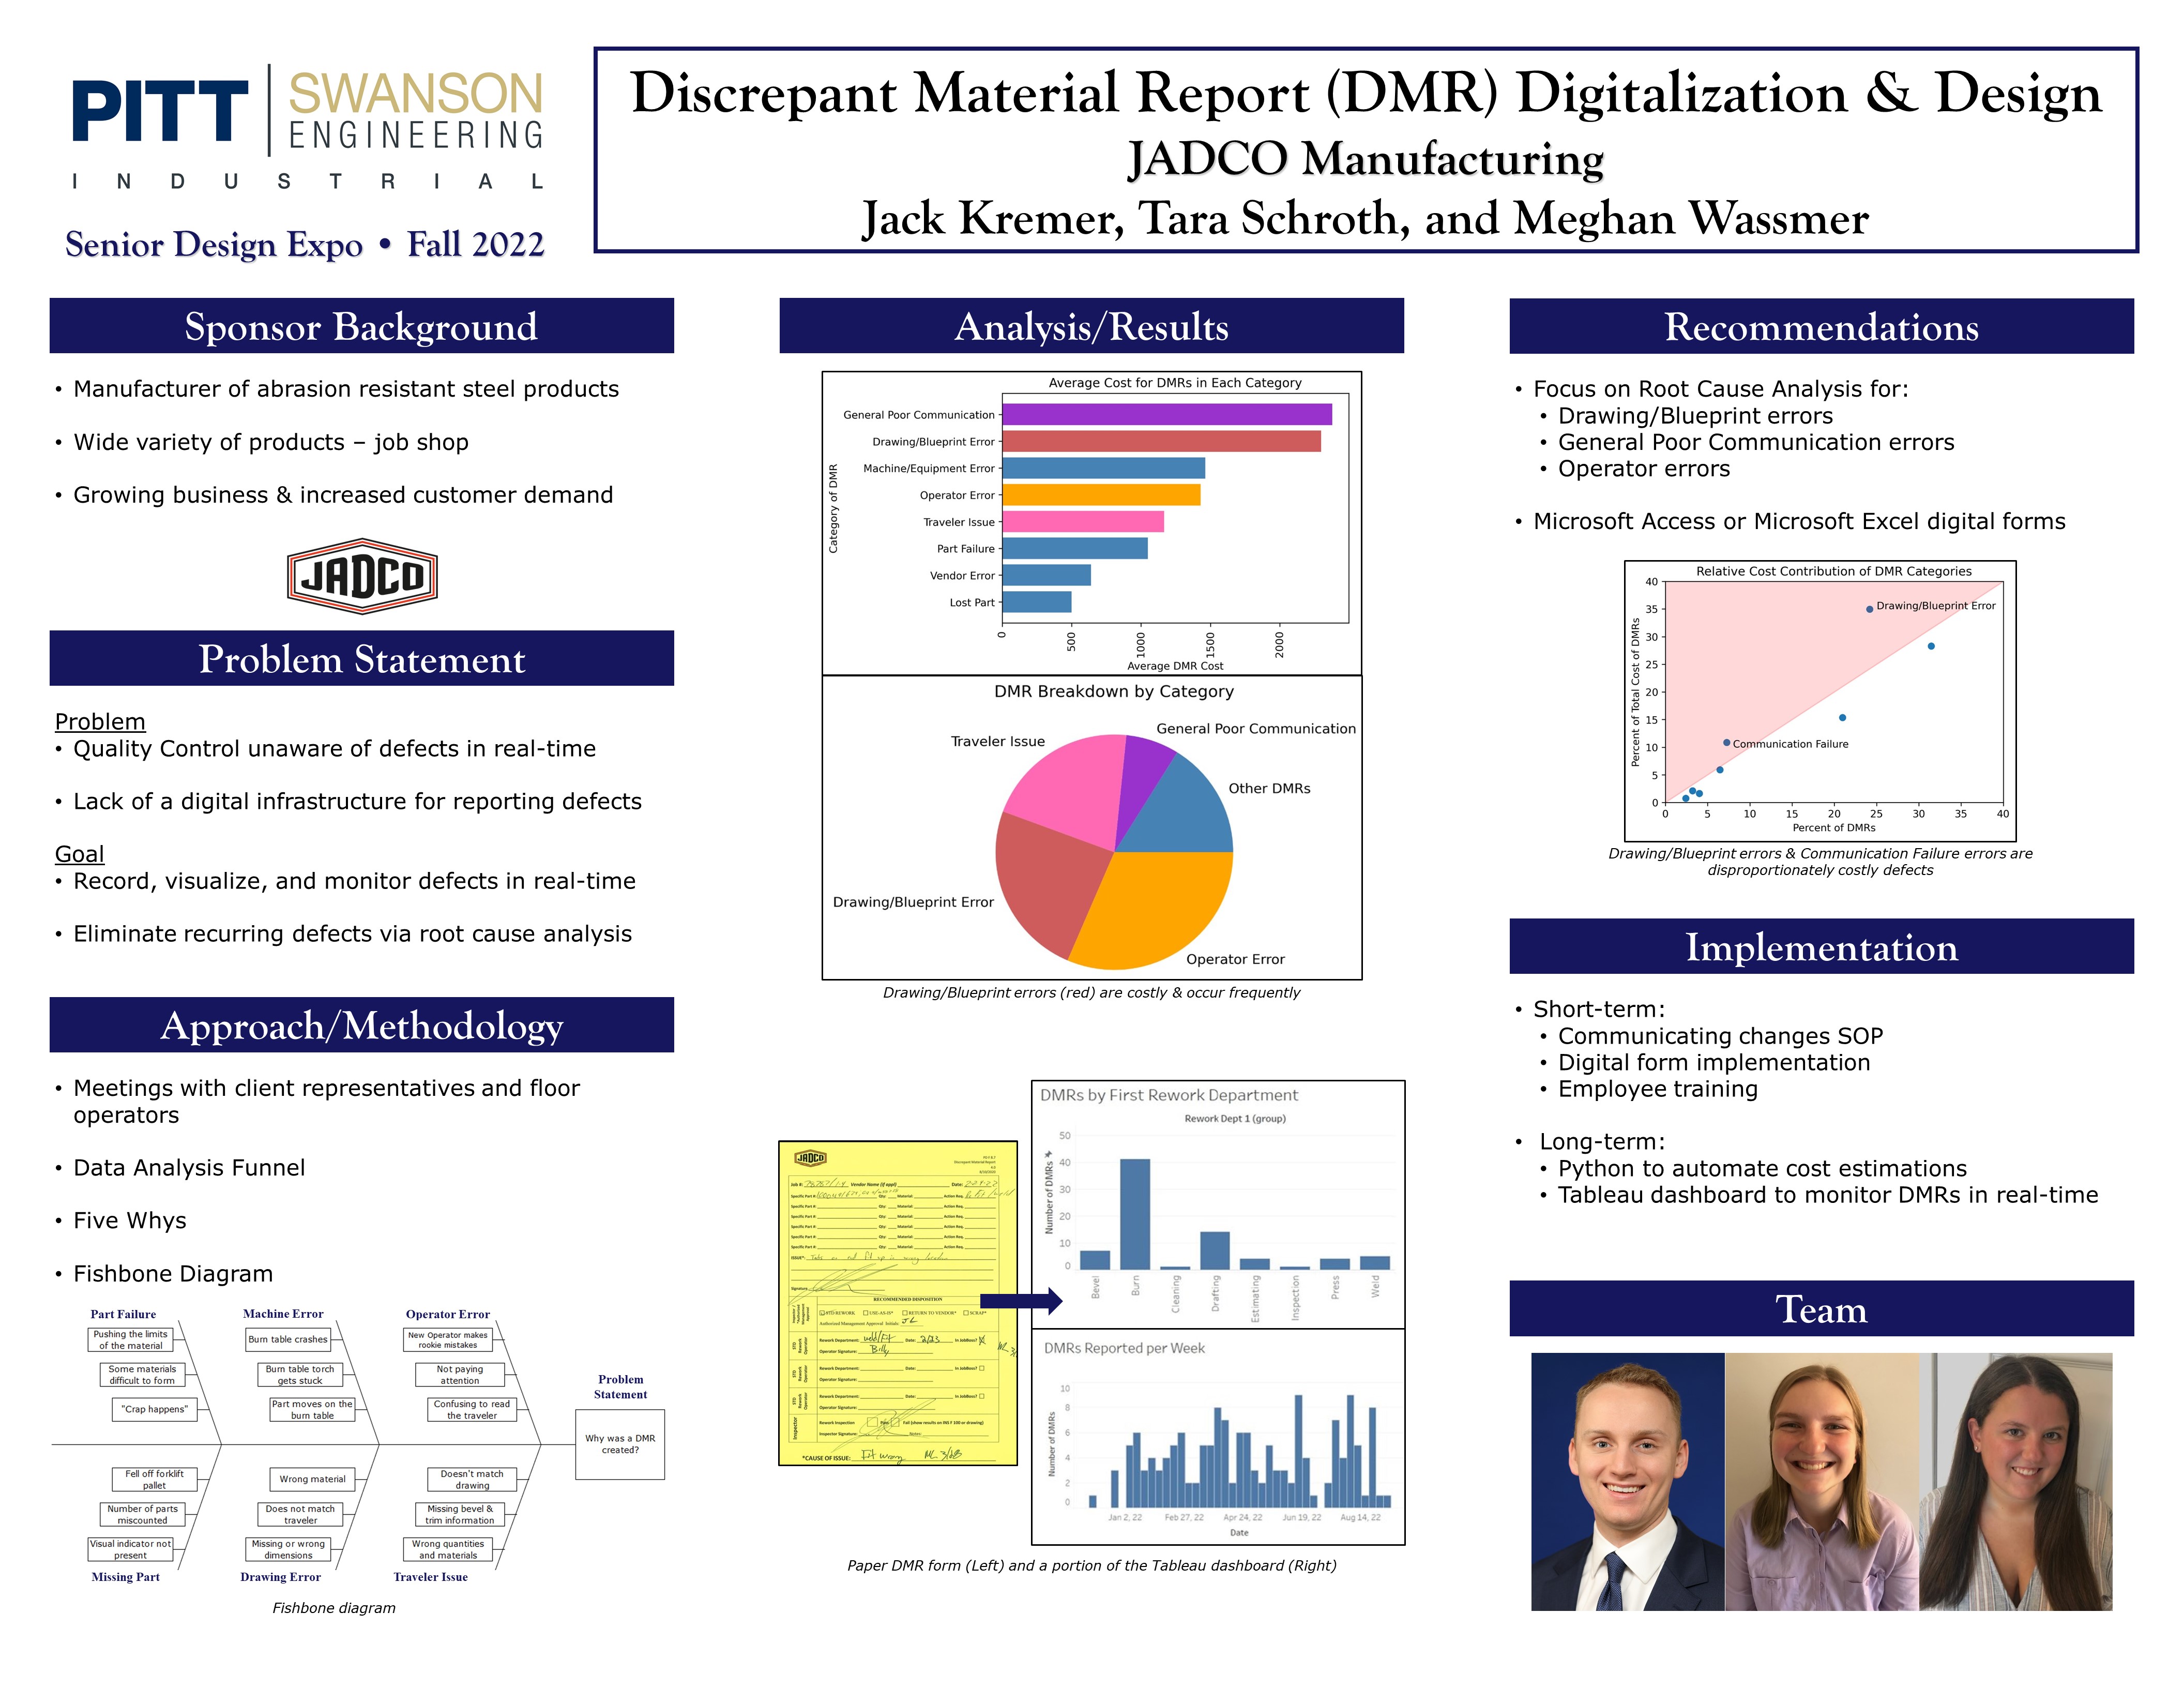
JADCO Manufacturing, a steel fabrication company located in Harmony, PA, currently has issues reporting defects throughout their entire production process. An older company that has experienced recent significant growth, JADCO has outgrown their legacy defect reporting system and asked our team to help digitize the process. Our team worked closely with JADCO’s senior management and quality assurance representatives to not only achieve this goal, but also identify root causes for recurring issues. Our approach consisted of designing multiple digital form design options, performing a cost analysis on jobs that had a defect, creating a tableau dashboard to visualize and monitor the defects, and generating recommendations based on our root cause analysis.
Based on our data analysis and root cause analysis, we recommend that JADCO focuses their effort on reducing defects related to drawing/blueprint errors and communication failures, because these issues contribute disproportionately to the costs incurred by defects. They can reduce these defects by implementing our digital defect reporting system and Communicating Changes SOP, which details who needs to be notified when a specific issue occurs. If JADCO implements our recommendations, they can expect to see a reduction in costs due to defects, better visibility of defects in real-time, and improved employee satisfaction.
Project Summary
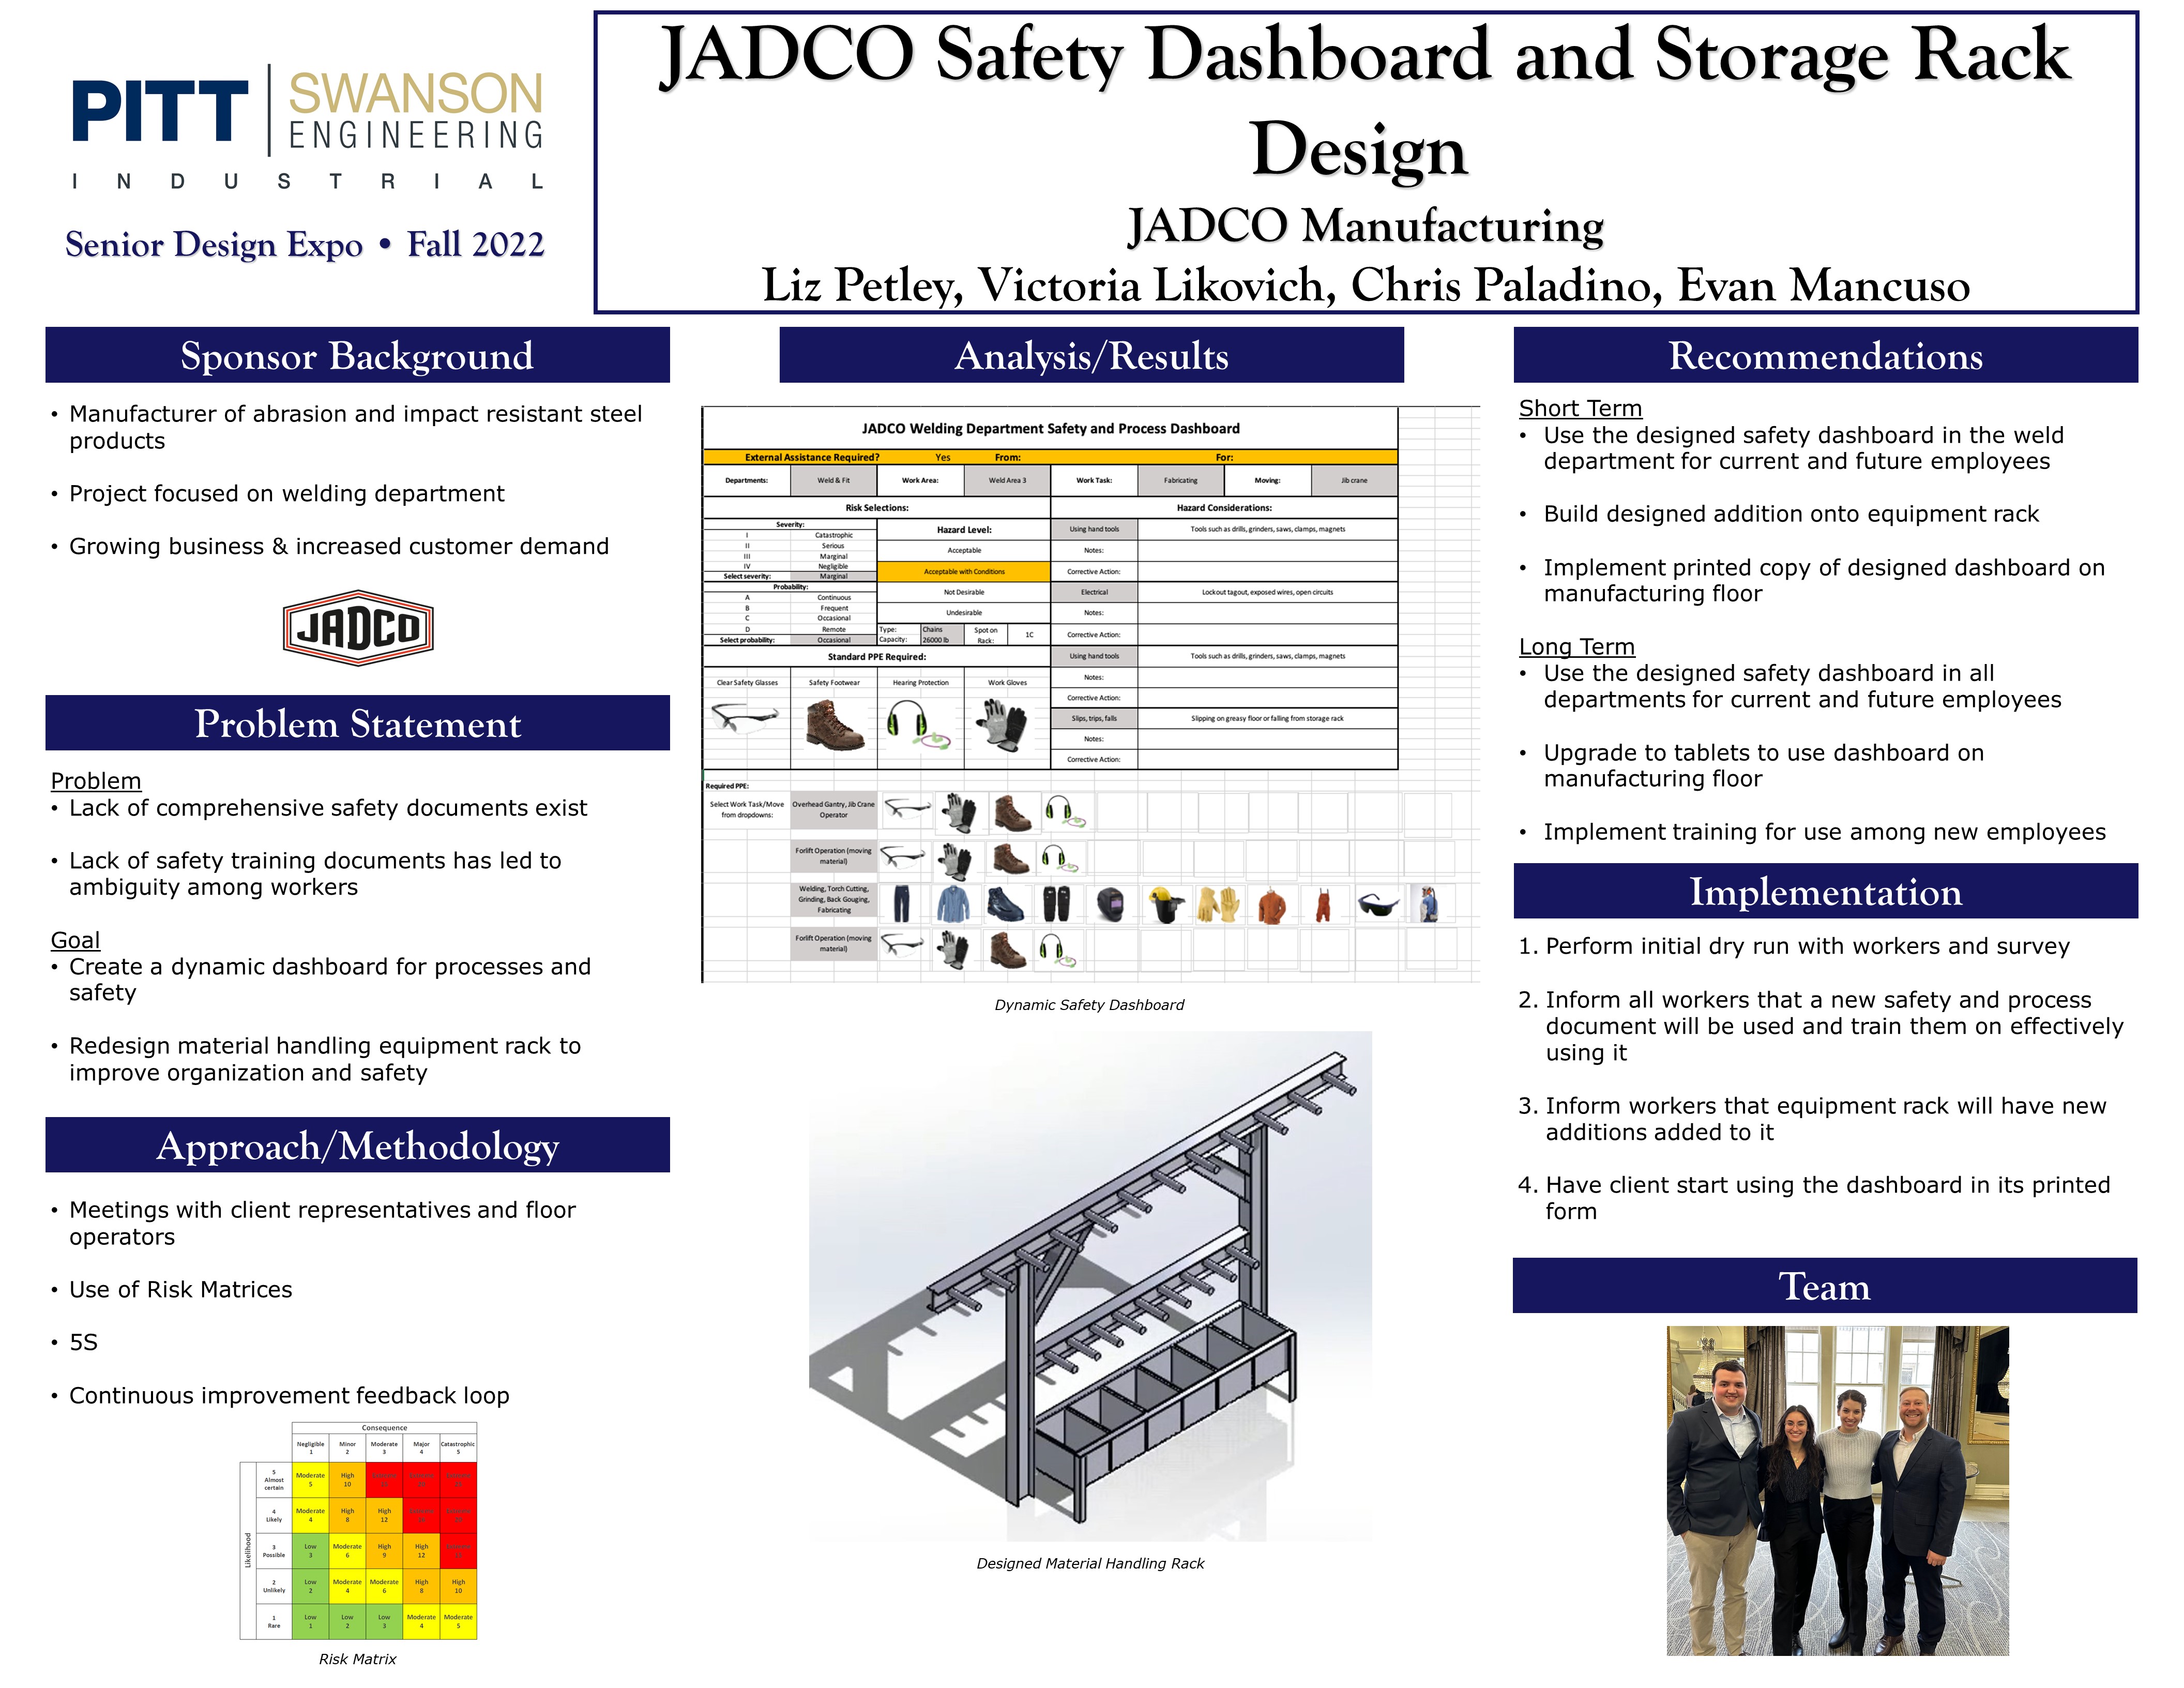
JADCO Manufacturing focuses on manufacturing quality impact and abrasion resistant steel products. In recent JADCO history, a lack of comprehensive safety documents and procedures has led to ambiguity among workers in terms of job performance and safety measures. The goals of the project include creating a dynamic dashboard in excel for safety and processes as well as the redesign of a material handling equipment rack. These will first be used in the welding department at JADCO. Within the created dashboard, fields such as which work area within the welding department, what the work task is, the severity and probability scores, and what PPE is required can all be changed depending on the job. Once hazard considerations and severity and probability scores are selected, a hazard level will show with a connected color. In order to eliminate safety hazards from the process, the redesigned rack no longer requires operators to perform lifts that present safety risks. As well, the dashboard has a field to select what type of material handling equipment is needed and the weight of the part to tell the operator what spot on the rack the necessary piece of equipment is located. This as well eliminates safety risks like choosing the wrong clamp out of the process by designing it into the dashboard. In the short term, the dashboard will be used in the welding department but in the long term, can be used in the entire JADCO plant. Another long term recommendation is to change from paper copies to tablets so the operators can fill out the dashboard themselves rather than the current way of having the safety manager do all forms. In conclusion, the designed dashboard increases worker understanding of safety in normal everyday tasks and associated risks with welding, grinding, etc.; redesigning the rack allowed for the connection between the dashboard and the rack to reduce misuse of equipment; and the dashboard proves the need for software such as this in manufacturing applications.
Project Summary
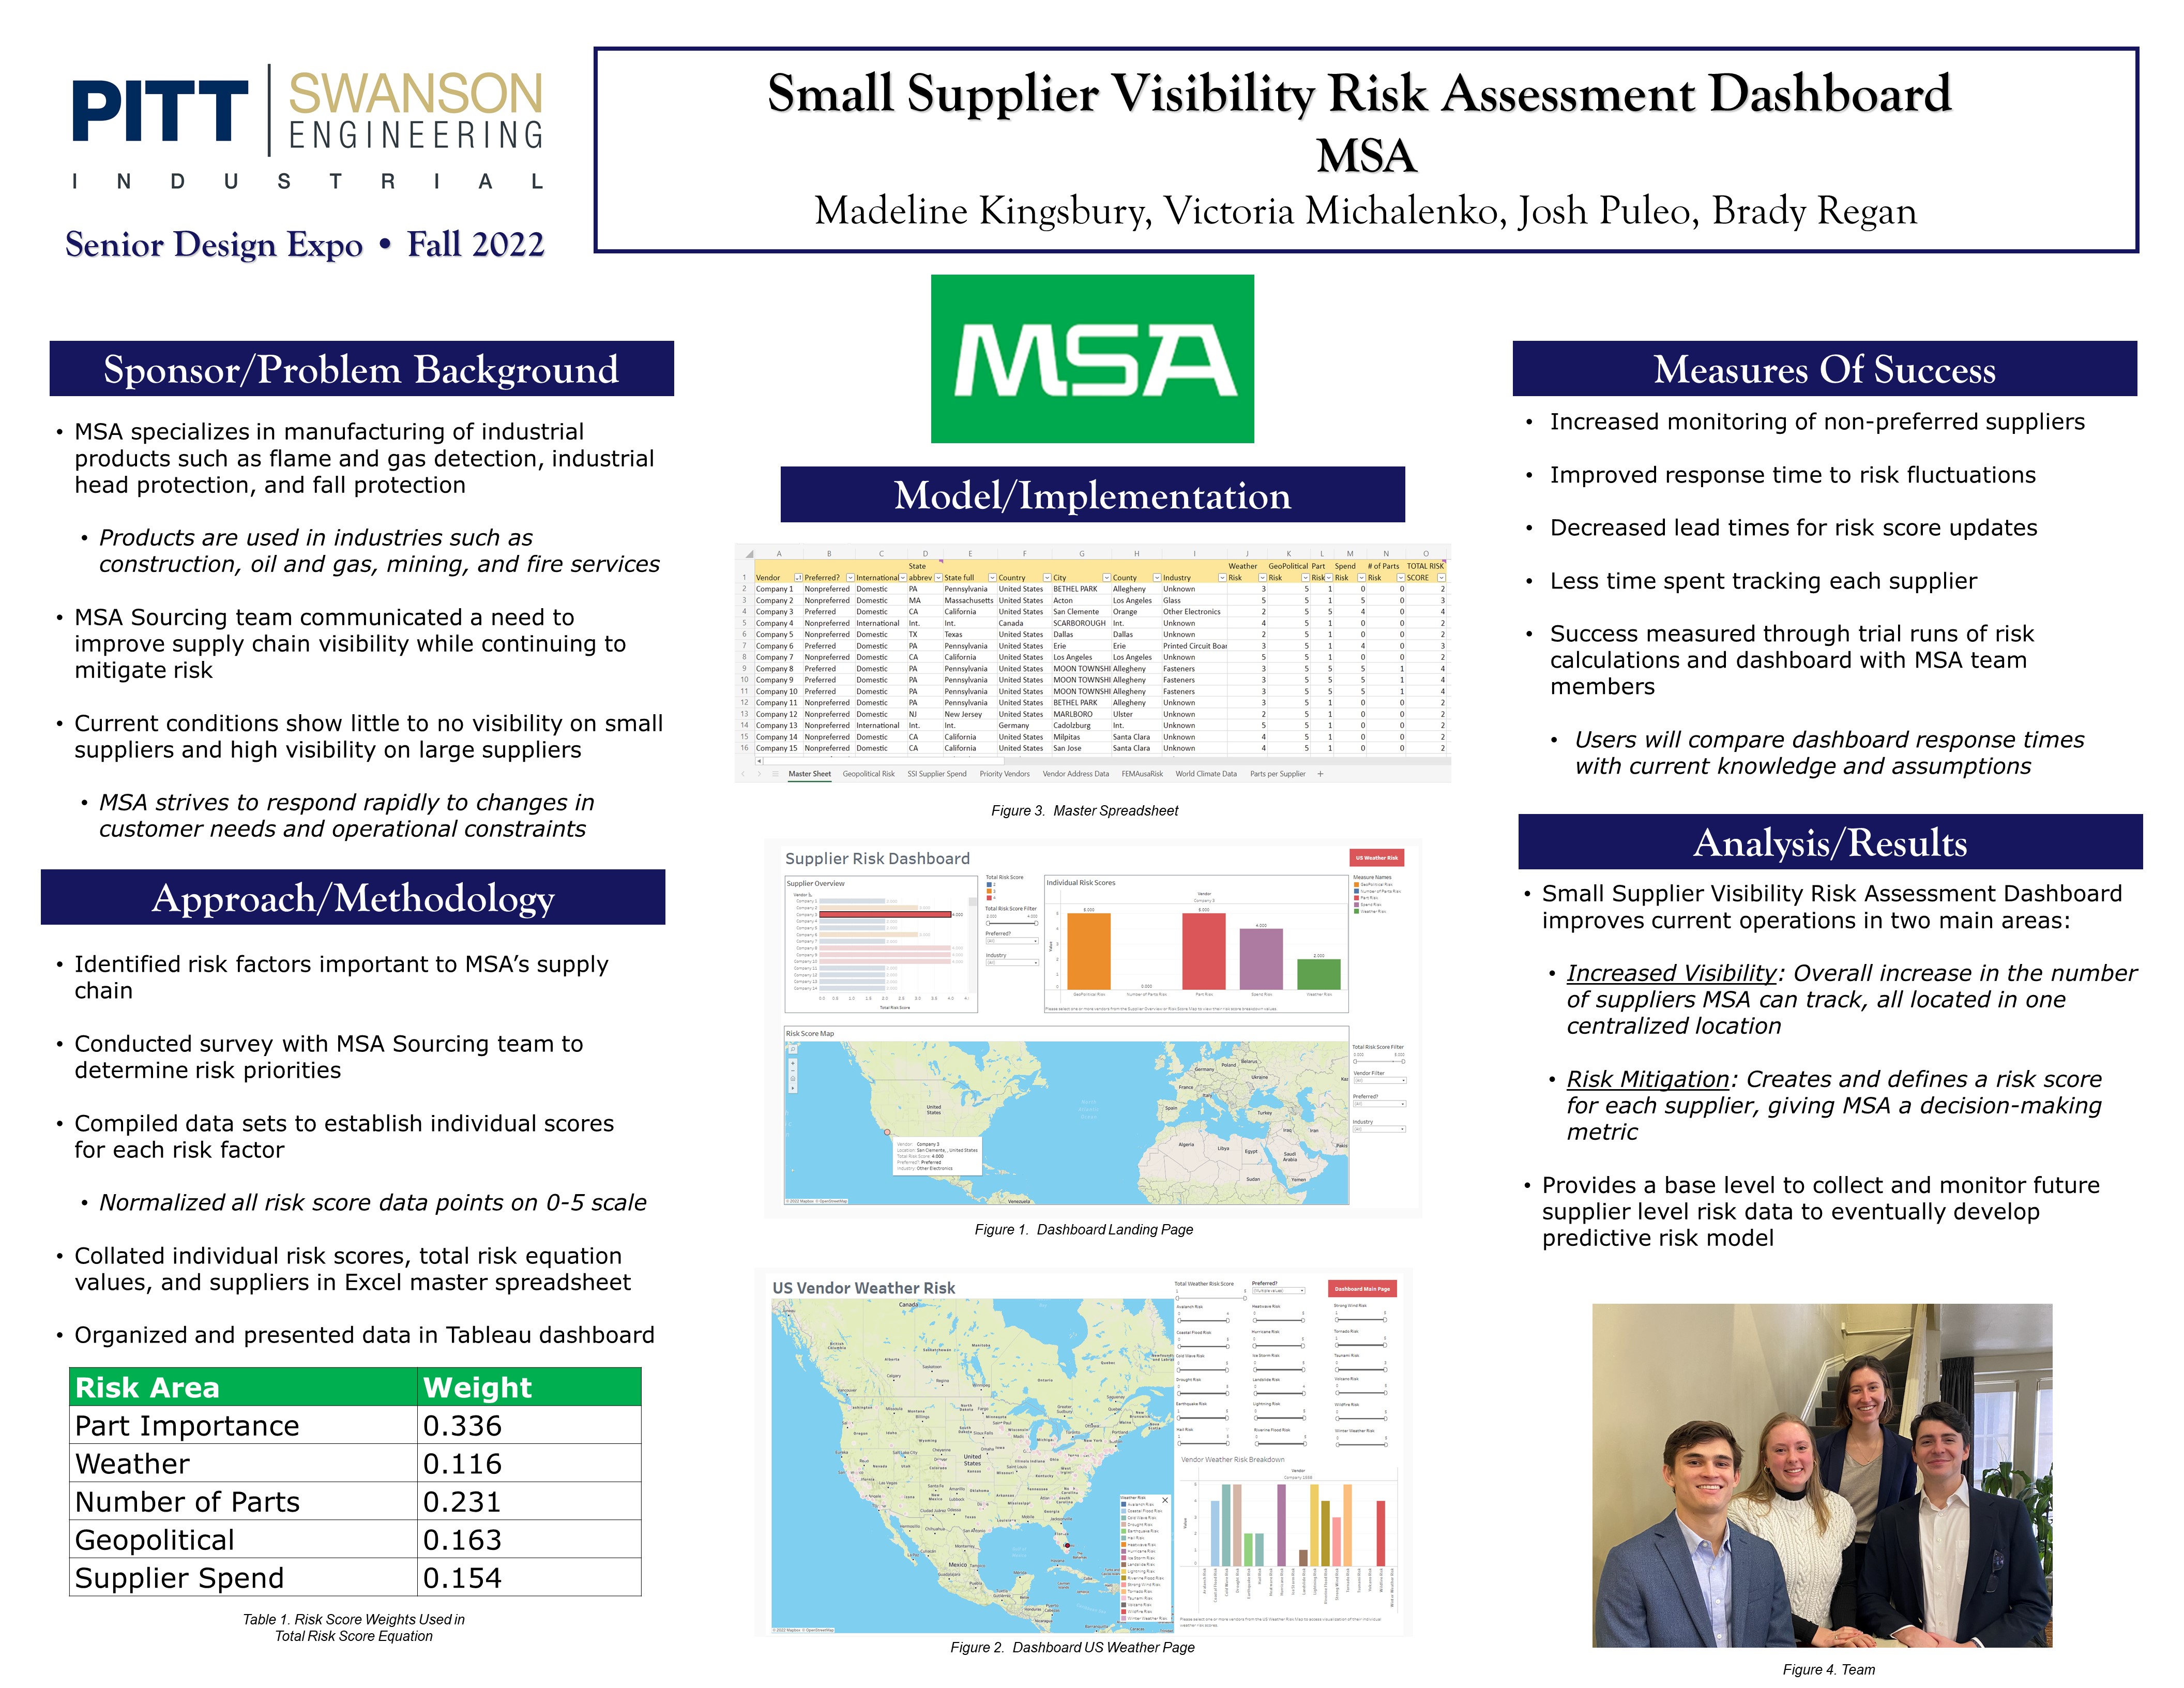
Exacerbated by pandemic constraints, MSA faces challenges ensuring on-time and consistent delivery from their suppliers. While MSA currently has robust services for monitoring and mitigating the risk of their larger suppliers, they do not have methods for monitoring and reporting risk for their smaller suppliers. The Pitt Senior Design Team was tasked with creating a dashboard to dynamically monitor MSA’s smaller suppliers. MSA desired a dashboard that would incorporate their current system, Dunn & Bradstreet (DnB), as well as various other risk scores. The goal was to build an intuitive and accessible dashboard that can be frequently updated to reflect a supplier’s current status.
To effectively achieve this dashboard, the Pitt Senior Design Team needed to first establish what types of risk were most relevant to be highlighted by the dashboard. Through a series of stakeholder interviews and surveys, five critical risks were identified. Those five risks were product importance, number of parts supplied, total spend, geopolitical, and weather. Supplier specific data such as product importance, number of parts supplied, and total spend were all provided to the Pitt team by MSA directly. The other metrics, which are region specific, were found using trusted online databases.
The final deliverable presented to the MSA is a web-based Dashboard created using Tableau. The Dashboard displays normalized and weighted risk scores for each supplier that MSA is currently using. The Dashboard has two main areas for further analysis. The first is a list of each supplier and their overall risk score with the ability to find the location of each supplier on the map as well as display a graphic highlighting how they performed in each risk category. The second is a map highlighting each supplier location with a weather risk panel, allowing the team to determine which suppliers are most at risk for specific weather disasters.
Through the use of this tool, we believe the MSA will be able to significantly streamline their supplier tracking operations. The Dashboard effectively fills the visibility gaps between large and small suppliers, creating a one-stop-shop for the MSA team to perform supplier-level risk mitigation.
Project Summary
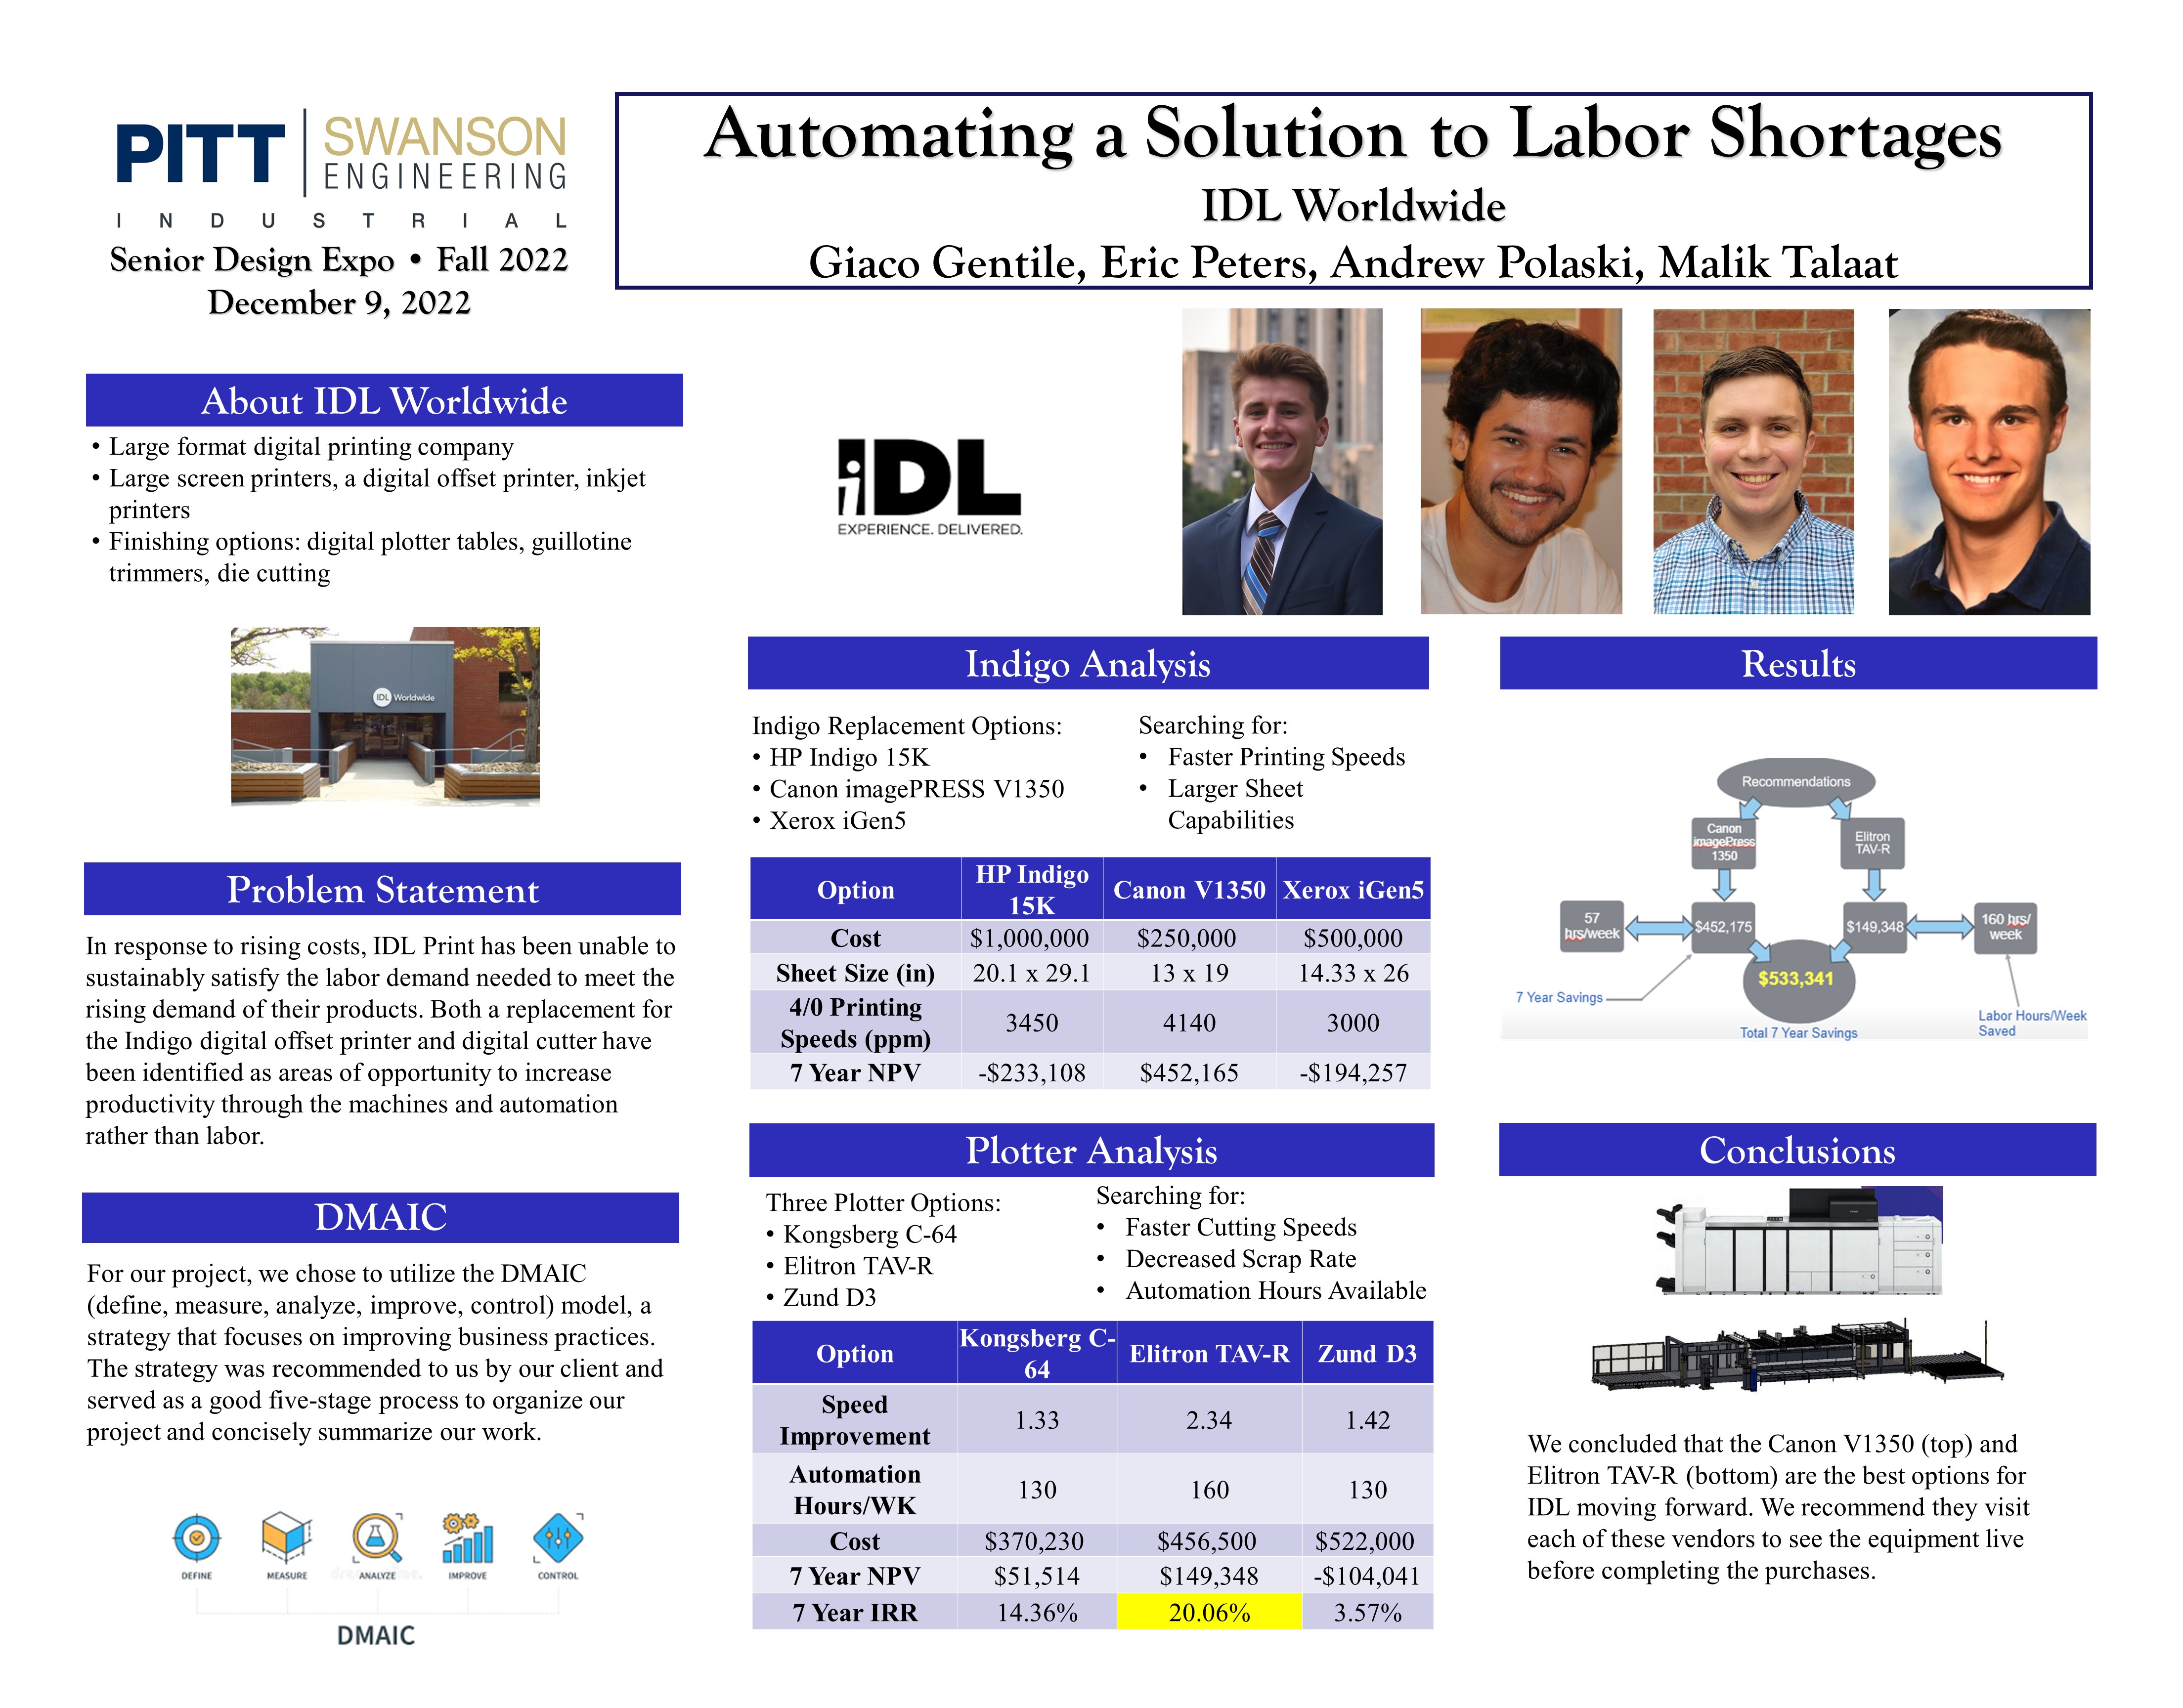
IDL Worldwide is a leading global brand experience agency that defines, creates, produces and transforms brand experiences. IDL works as a job shop that can design, print, cut, and finish graphics that allow companies to advertise their products as needed. IDL has recognized that its demand is expected to grow in the next few years and believes that they will not be able to hire the labor necessary to meet these rising demands. In response, they are considering two different opportunities to investigate automation options to increase their fulfillment capacity without the need to hire new labor. The Indigo Digital Offset printer has been identified as one possibility to replace, as the current printer is underutilized due to its limited ability to only print on a small selection of materials. The second area of opportunity is a replacement or addition to the digital plotter tables for product finishing and cutting, as the current plotter tables cut at a much slower rate than manual cutting methods. In order to determine if IDL should invest in new technologies for these two areas, our team first had to gather information on the current usage of the Indigo Printer and Plotter using datasets provided by IDL. For the indigo, we considered available technologies that could increase the number of orders that could be printed from a digital offset printer method, and for the plotter we searched for faster plotter tables that could automatically load, process, and unload sheets. After finding some options and comparing them to the current means of production, it was concluded that the Canon imagePRESS V1370 would be the most fiscally viable option to replace the indigo, saving 57 labor hours per week and decreasing IDL’s need to outsource materials, and the Elitron TAV-R was identified as the best addition to the plotter capacity by adding 130 automated hours to the finishing department. With a 7-year payback period and 10% MARR, the Canon impagepress1370 net present value comes to $452,175 and the Elitron TAV-R comes to $149,348. Combined, these two recommendations come to a total present value of $533,341.
Project Summary
LMI, or Logistics Management Institute, is a large government consulting agency headquartered in Tysons, Virgina. They are dedicated to powering a high functioning government with their complex digital and analytical solutions, logistics, and management consultancy services. One of the key business units of the organization is the Enterprise Technology Service Management team. They are responsible for the procurement and distribution of laptops and other technology throughout the organization. An issue they have recently identified as a target is the lack of laptop supply and inability to keep up with the frequency of new hires, upgrades, and other needs for laptop fulfillment within the company. Based on the information provided there were three main factors contributing to this; variable and low visibility of lead times from suppliers, interdepartmental communication, and externally, the inconsistency of the global supply chain. We collected and cleaned hiring, termination, invoice, and lead time datasets from the client and client’s supplier which allowed us to conduct a statistical analysis on the flow of laptops throughout the internal supply chain of the LMI. A linear and centered-moving-average based regression was run on each month for hiring and terminations datasets. This determined that there were monthly effects in January and September for hiring, and April for terminations. From these findings, we applied the regression equations to a model that optimized ordering time, quantity, and inventory levels. The model also accounted for other variables presented by user input which included lead time, date, inventory, hiring/acquisition buffer, supplier distribution, and a safety stock buffer. It then took those inputs and returned two order schedules based on long lead times exceeding 4 weeks and normalized lead times for the proceeding three months. This model was developed as an Excel workbook using macros and VBA (Visual Basic) code. Its main purpose is to increase visibility on laptop demand and create an optimized ordering schedule for LMI to use as a guide for their laptop procurement method and was implemented to do so. In conclusion, we were able to save LMI 25% on ordering costs, deliver a functional excel tool with elements of flexibility and simplicity, and decrease laptop supply stockouts. We recommended that the client maintain a schedule of evaluating ordering on the first of the month and keeping 2-3 weeks of inventory on hand to account for any extreme unexpected cases.
Past Projects
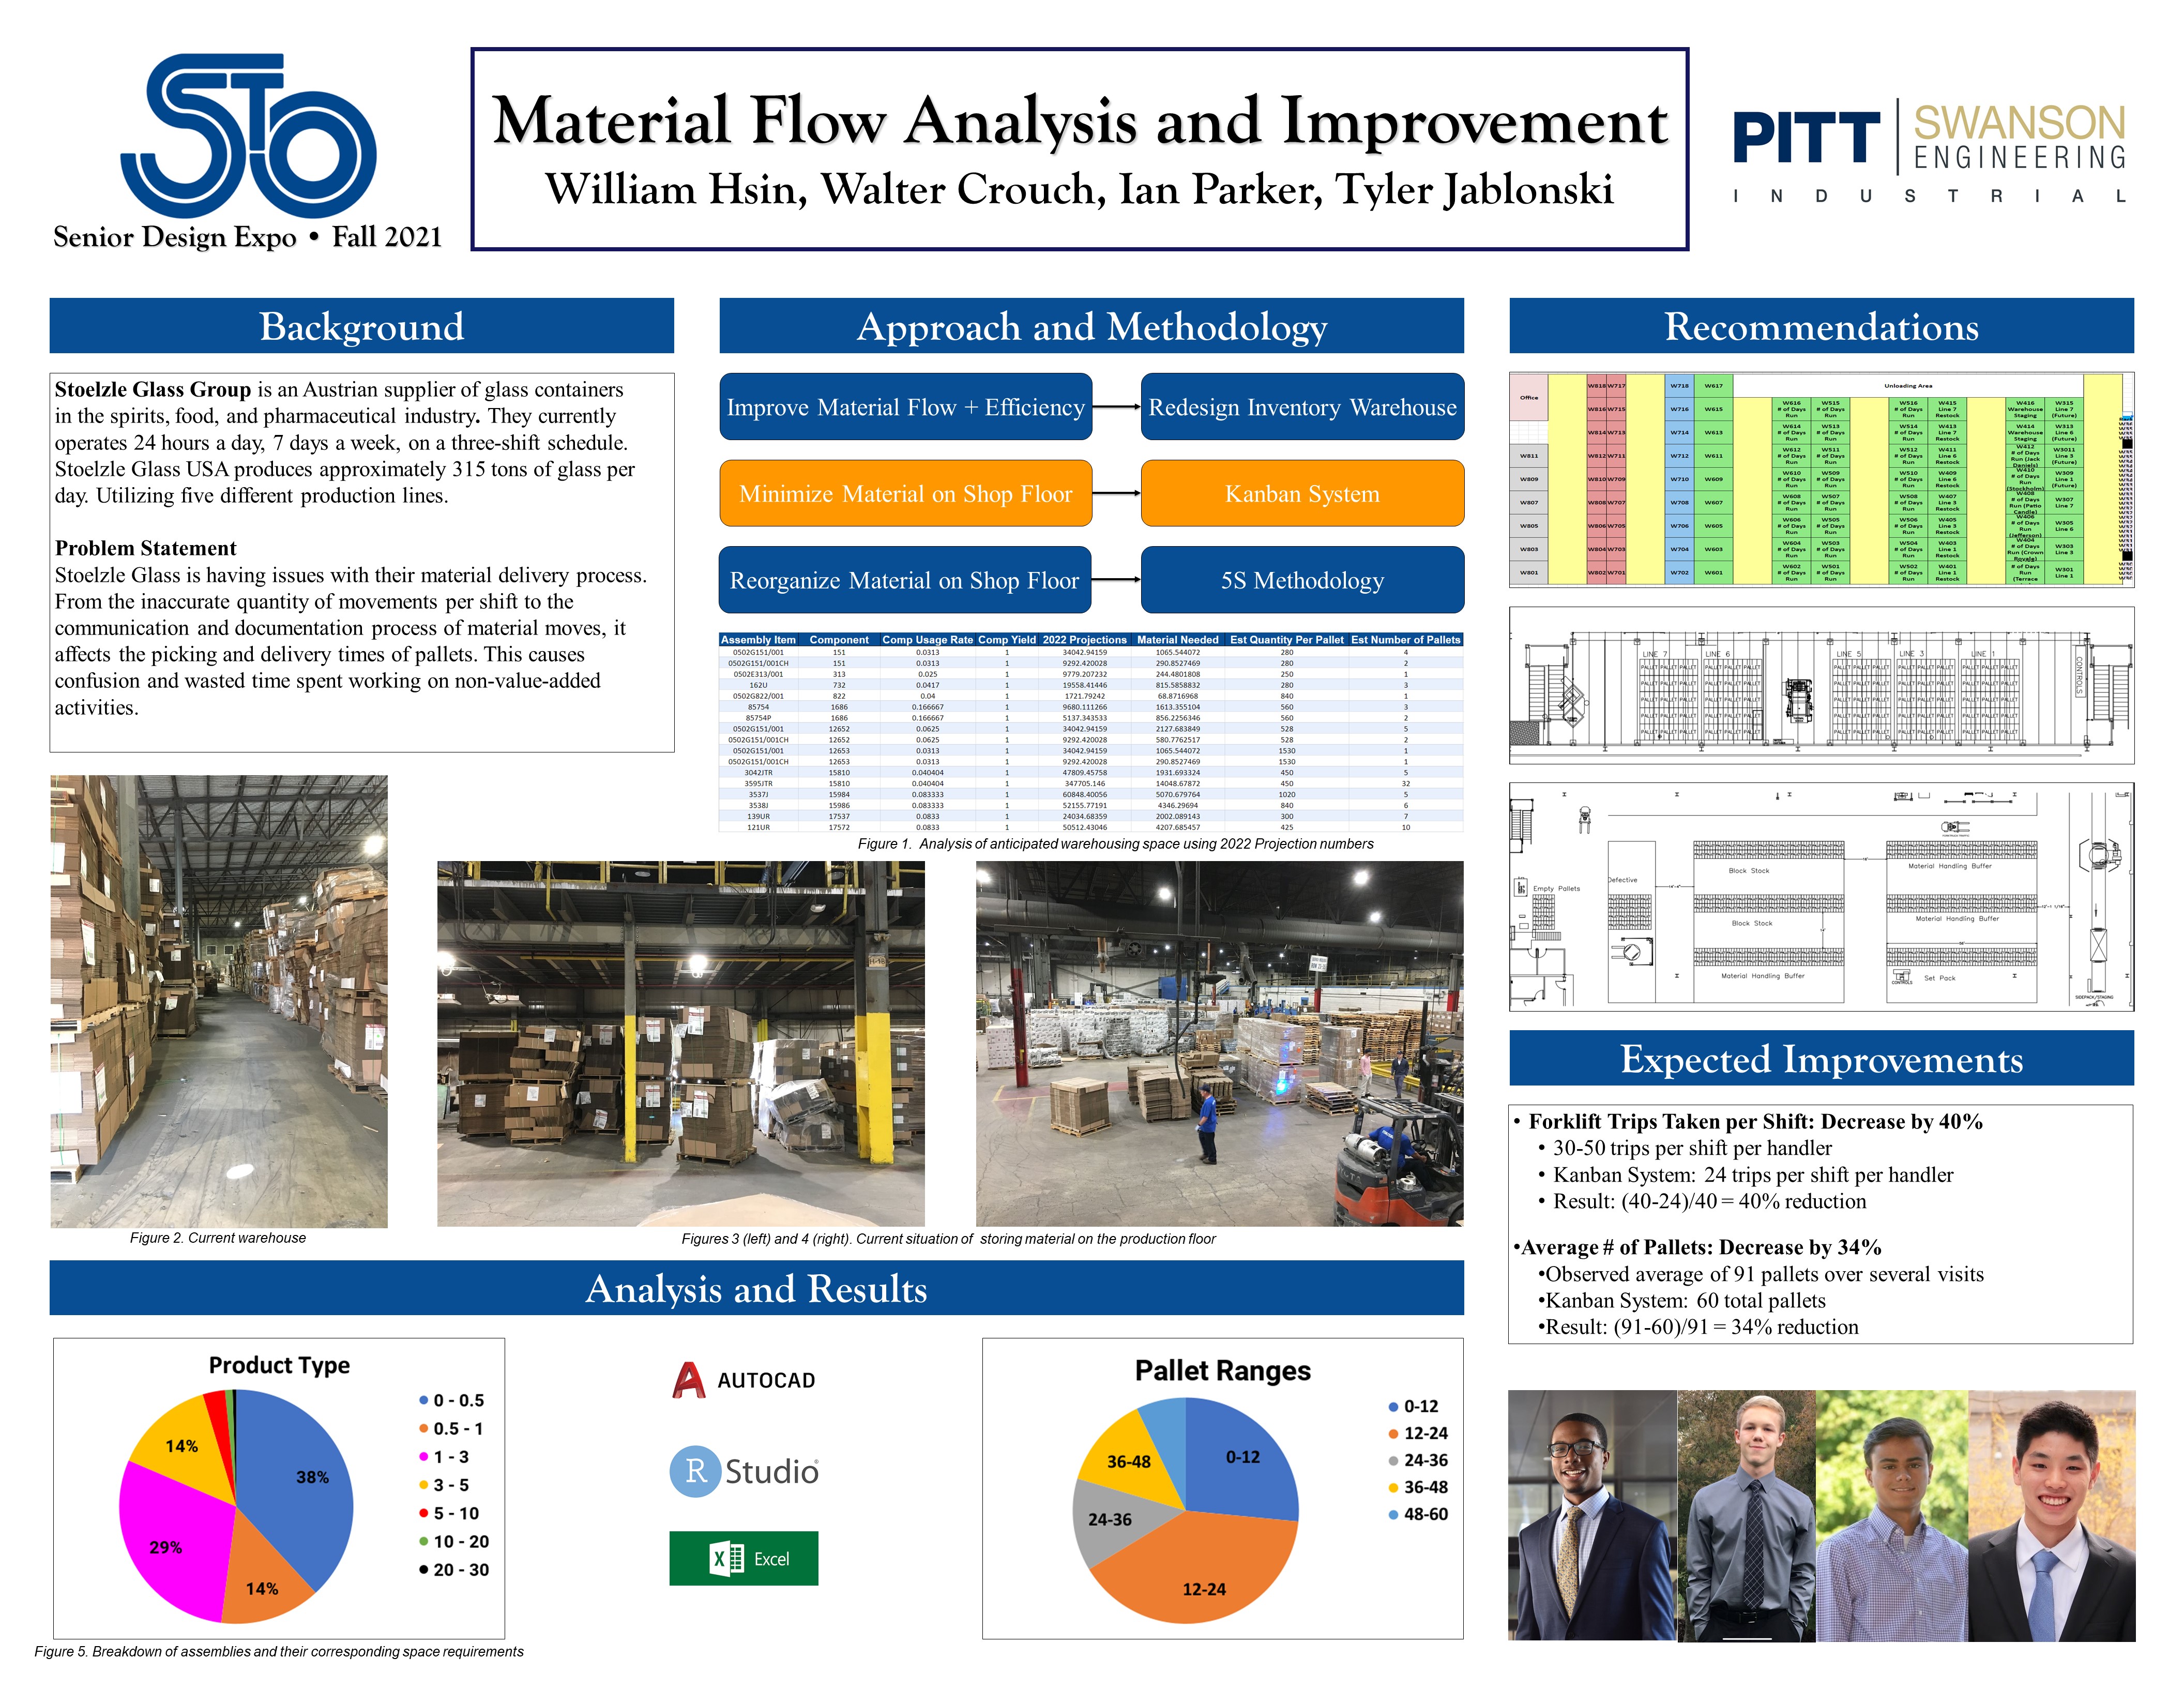
Project Summary
Stoelzle Glass is having issues with their material delivery process. From the inaccurate quantity of movements per shift to the communication and documentation process of material moves, it affects the picking and delivery times of pallets. This causes confusion and wasted time spent working on non-value added activities. For our approach, we decided to focus on three simple aspects that would have the biggest impact. To be able to implement easy solutions that would be flexible to change and fully supported by sound analysis. In regards to the main findings, we found that there is a lack of visibility when it comes to the flow of material. This refers to the delayed key in of material moves into Oracle that creates uncertainty in how much and when material is needed. This results in the disorganization of inventory and excessive amount of packaging materials on the production floor. Consequently, this eventually leads to inefficiencies in transportation and inventory management, negatively affecting overall material flow in the facility. For our recommendations, we believe in implementing a new inventory warehouse, a Kanban system, and 5S methodology to solve these issues.
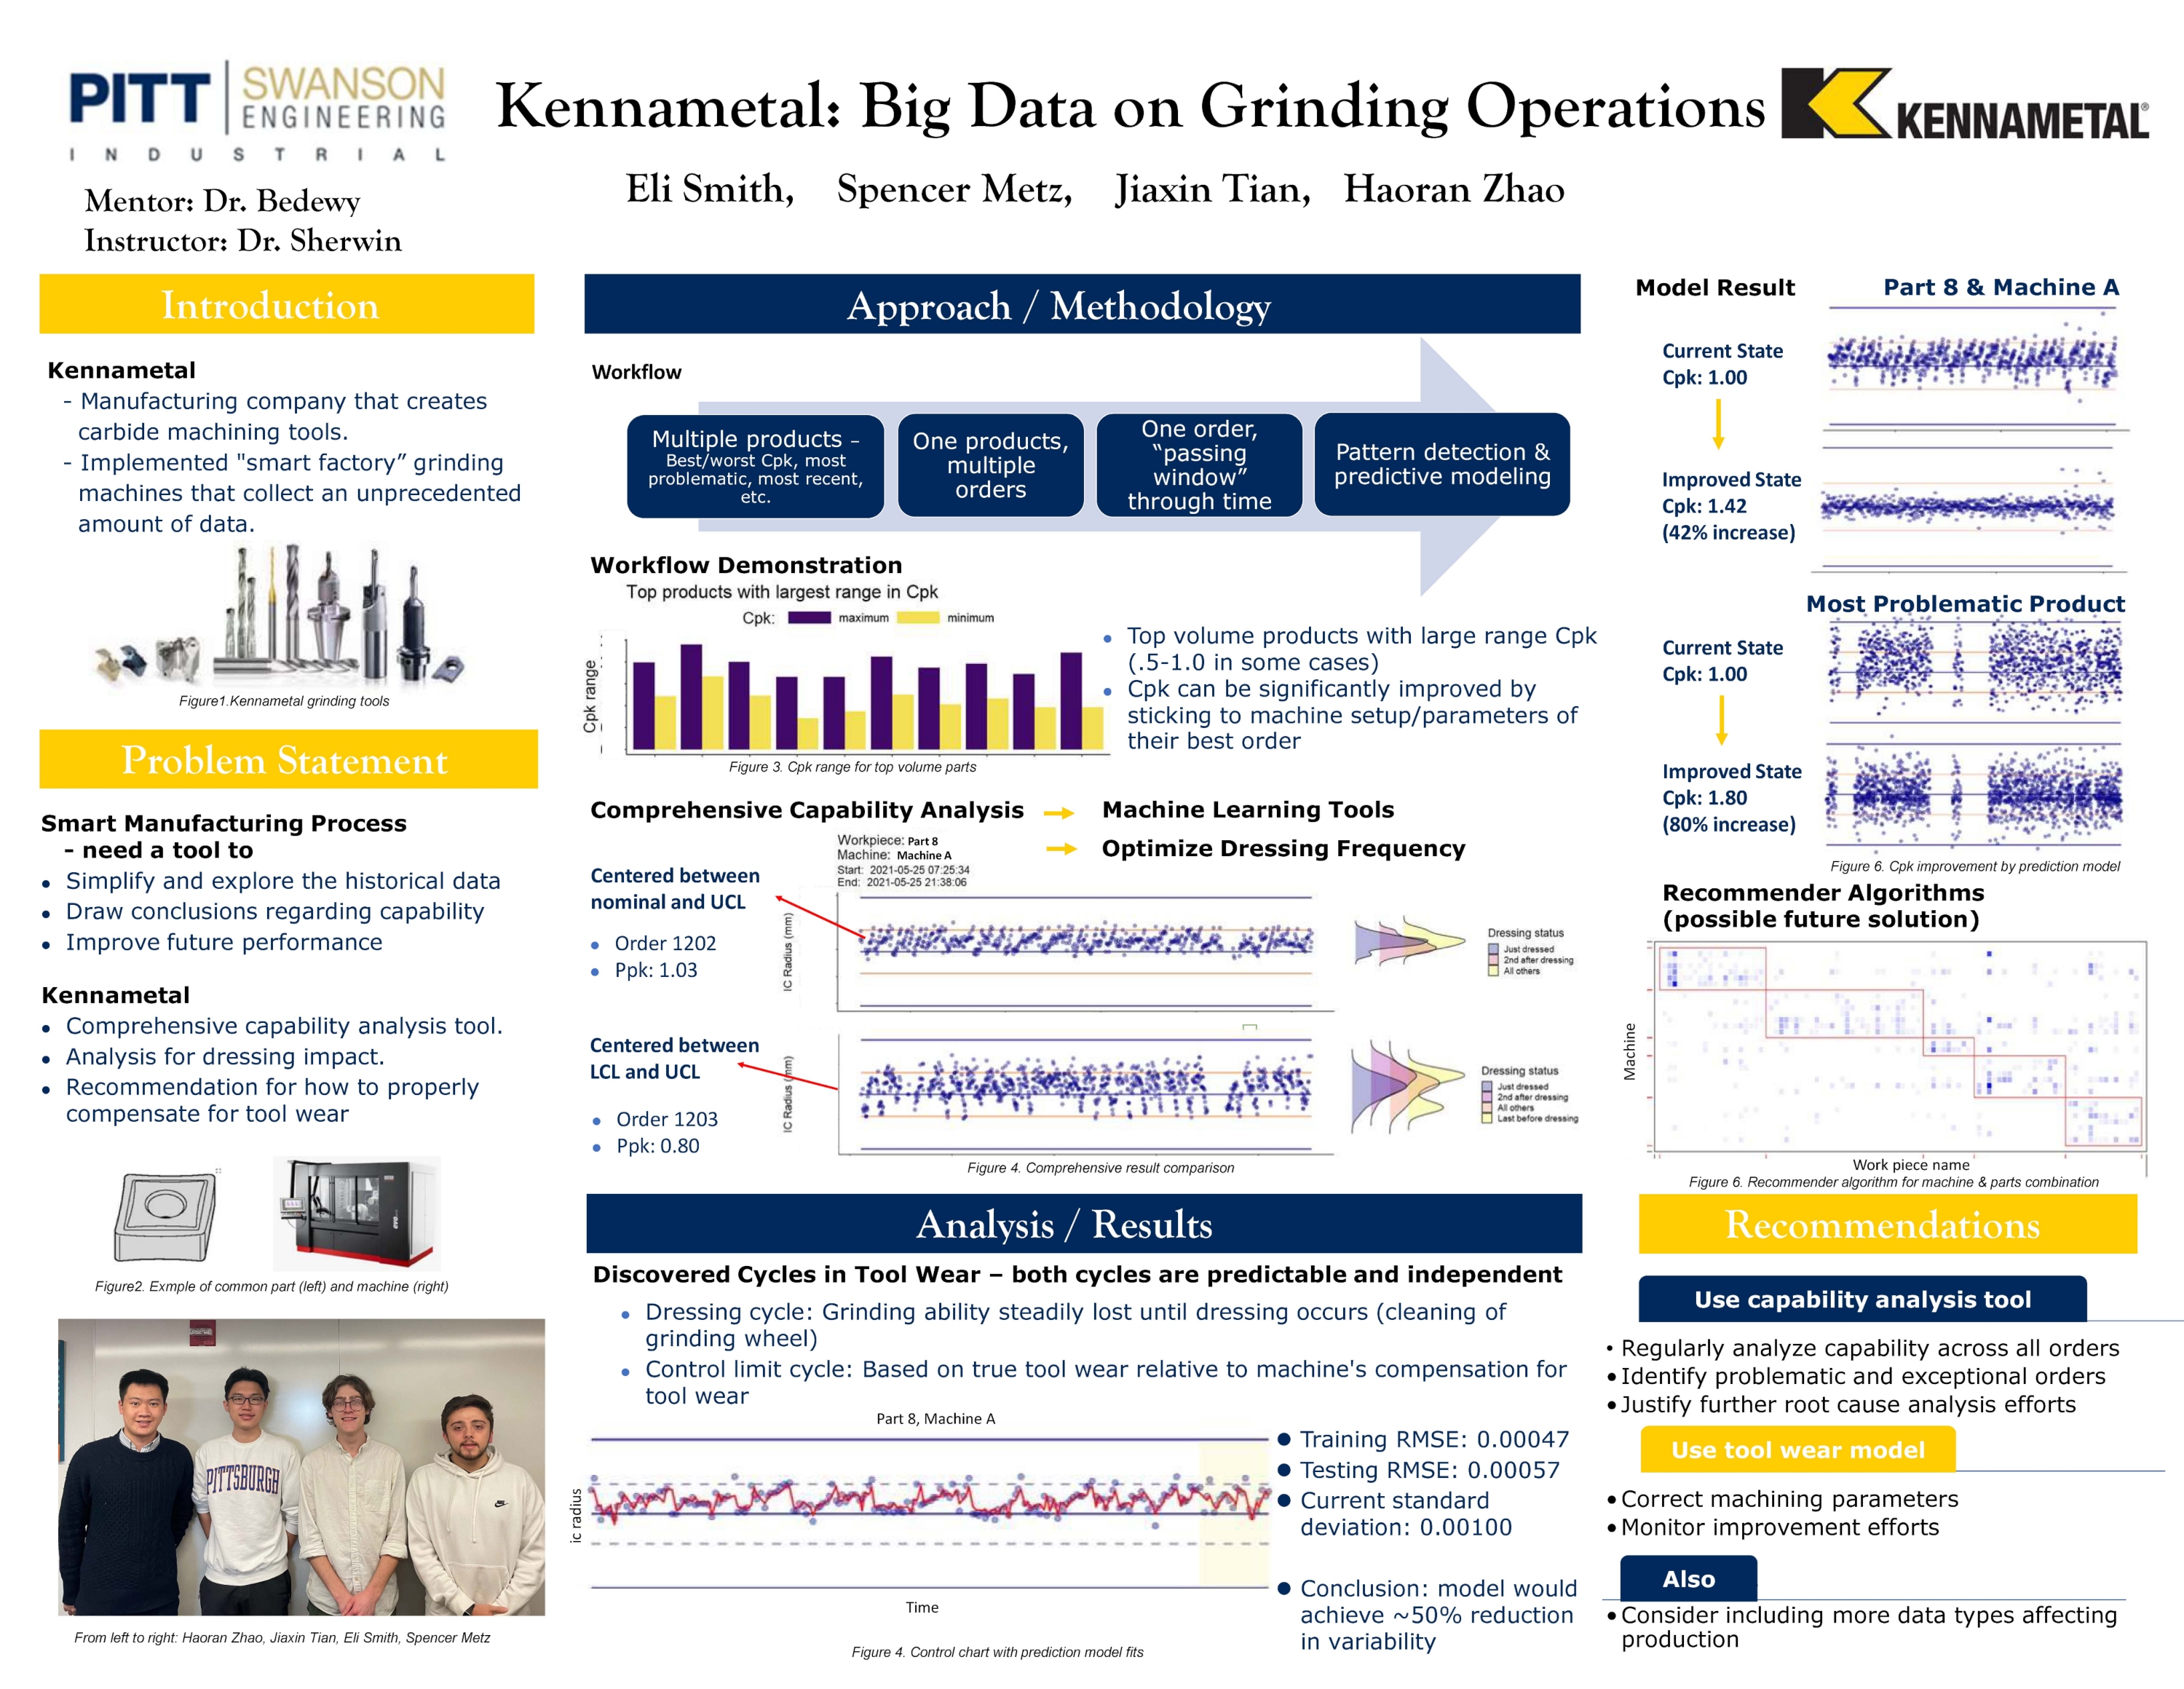
Project Summary
This semester we worked closely with the data and quality team at Kennametal. Kennametal is a manufacturing company that creates carbide machining tools. They have recently implemented "smart factory" grinding machines that collect an abundance of data that can be overwhelming and impossible to draw conclusions from. A system is needed to allow Kennametal to simplify and explore their historical data, draw conclusions regarding capability, and understand patterns that can be used to improve future performance. To address this problem, we created a suite of tools that gives the user a complete picture of their process.
Functions of System:
- Easy preprocessing functions to correct the input data from machines immediately
- Current state analysis displays
- Comparative visuals to help identify processes of interest
- Ability to zoom in to the machine, part id, order, or piece level
- Analysis at the part-by-part level to give insight into sources of variability
This tool will be used by Kennametal to better understand their grinding processes and act as a basis for future root cause analysis projects. Using our system, we found one major source of variability and were able to explain the mature of the source. In grinding operations, tool wear occurs rapidly and must be compensated for. Currently, the grinding machines use two compensation cycles that act independently of each other but do not account for how the process changes when their resets occur simultaneously. We found that if possibility of simultaneous resets is accounted for, Kennametal can increase capability of their highest volume processes by up to 96%. In the few cases we explored, we found opportunities for major improvement in Kennametal’s manufacturing process using this system. We recommend Kennametal applies this system to their entire manufacturing process to find and explain other sources of variation in their processes.
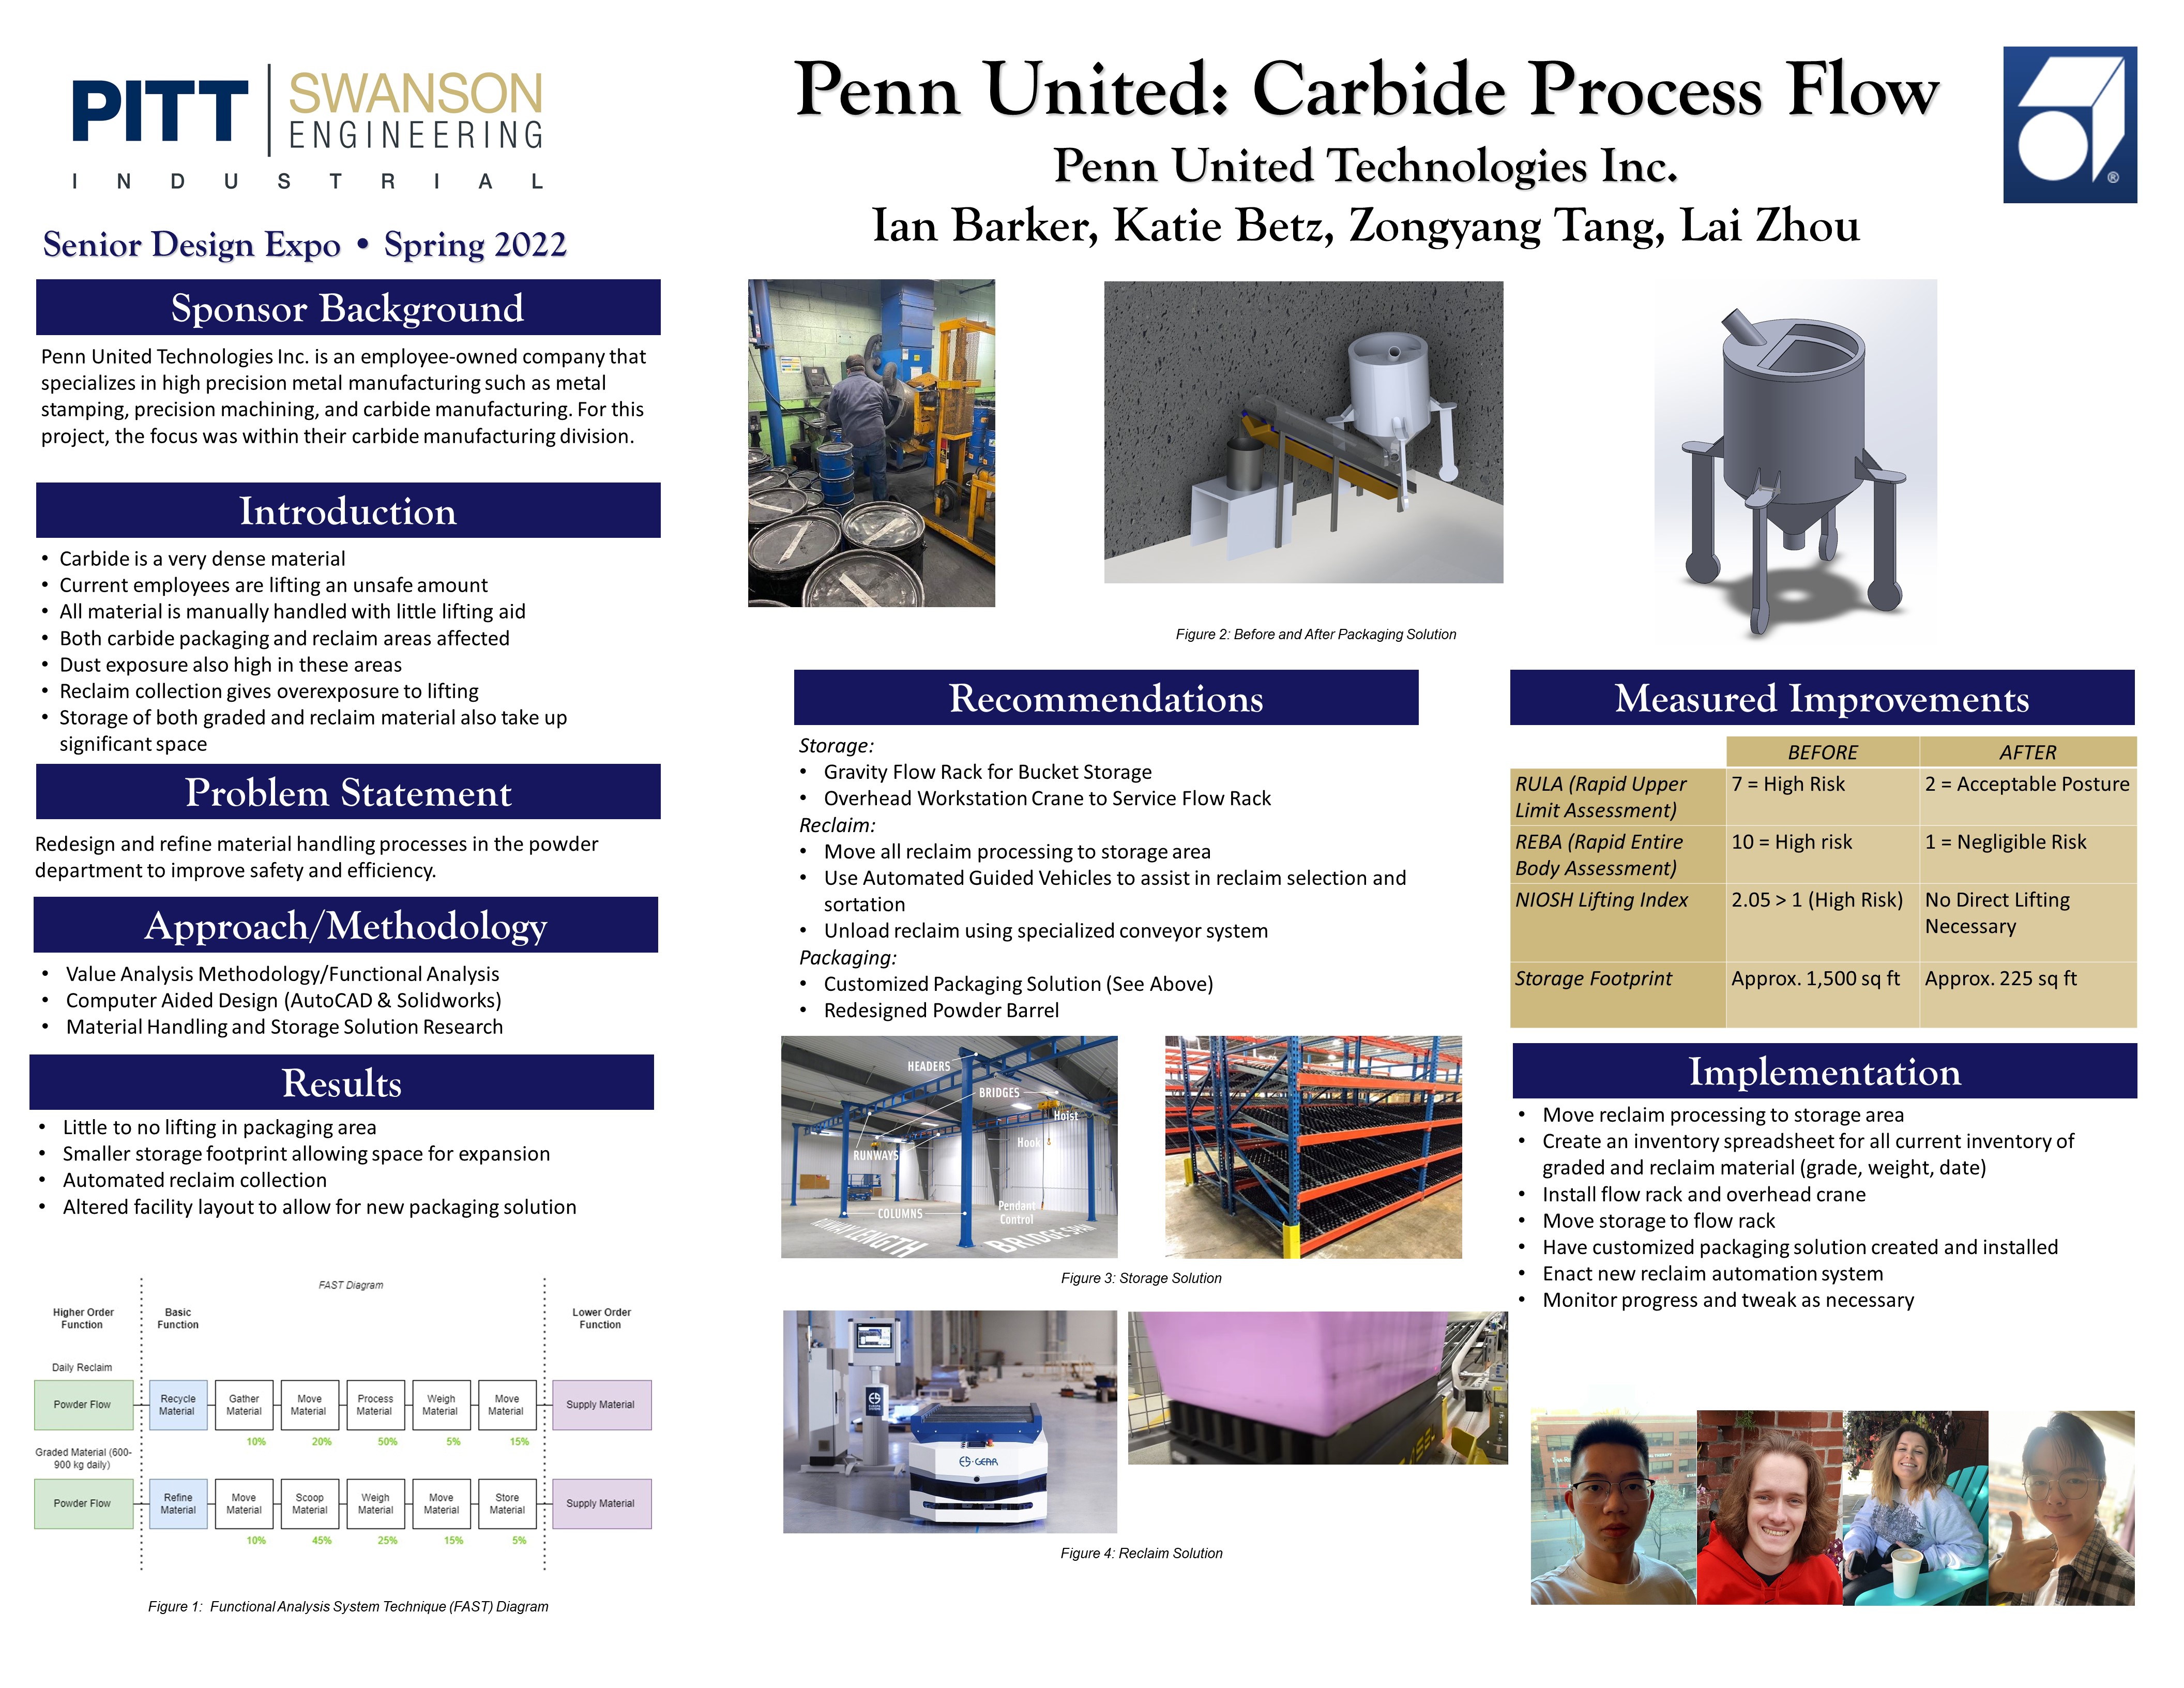
Project Summary
This semester our group worked with Penn United Technologies Inc., an employee owned high precision metal manufacturing company. We worked specifically with their carbide manufacturing division in the areas where they package and reclaim their graded material. Our problem statement is as follows: To redesign and refine material handling processes in the powder department to improve safety and efficiency. Currently in there areas, employees are at risk for ergonomic related hazards due to lifting overexposure and unsafe lifting loads. In addition to reclaim and packaging, storage reorganization was also necessary to allow for more working floorspace.
We were able to break up the three problem areas, storage, reclaim and packaging into three separate recommendations. Within storage we recommend implementing a gravity flow rack and a workstation crane to decrease the storage footprint from approximately 1,500 sq ft to 225 sq ft and provide aided lifting in the storage area where there previously wasn’t any. For reclaim, we recommend moving all reclaim processes into the same area to concentrate all equipment together and provide space for the new packaging solution. We also recommend the use of automated guided vehicles to automate the process of reclaim pickup which reduces employee overexposure to heavy lifting. Lastly, we redesigned the packaging process so that material is loaded into buckets using a conveyor system which removes the necessity for any heavy lifting. Before implementation, RULA, REBA, and NIOSH scores for the lifting done in the area indicated that employees were at a very high risk of erogonomic hazard. Should Penn United move forward with our solution, little to no lifting would be required within this area.

Project Summary
The ability to regulate the mechanical stiffness in a large range could be crucial for soft robots to conform, grasp, and move while interacting with the environment. Stimuli-responsive materials can be used to achieve shape morphing. Liquid crystal elastomers (LCE) are heat-responsive materials with regular deformation properties when raised or reduced temperature. Polyether ether ketone (PEEK) is a semicrystalline thermoplastic with excellent mechanical and chemical resistance properties that are retained to high temperatures.
In this project, our team designs, tests, adjusts, and optimizes the “LCE cylinder with PEEK disks tethered to a string” structure. Our team successfully demonstrated that when heat is applied to the structure, it would shrink in the axial direction, and the disks inside would jam together to create a rigid cylinder. When heat is removed and cooled, the structure returns to its original versatile state. Our desired goal was to satisfy at least a 10% stiffness difference between the soft and rigid states through jamming phenomena.
Our team was able to design a series of 12 experiments. We mainly explored two independent factors, the number of disks and the level of excessive compression, and found the relationship between these factors and stiffness difference. Through our experiments, we are confident that when weight is applied to our structure, at least 10% stiffness change requirement is met, with stiffness differences varying from 37.93% to 185.85%. The structure with 6 PEEK disks in the LCE with a 10% excessive level of compression design has the best overall performance. More replications can be conducted to increase the stability and accuracy of the results in the future.
Our project provides a heat-responsive system that changes stiffness on command repeatedly. This opens the door for a variety of soft robotics and applications in different industries.
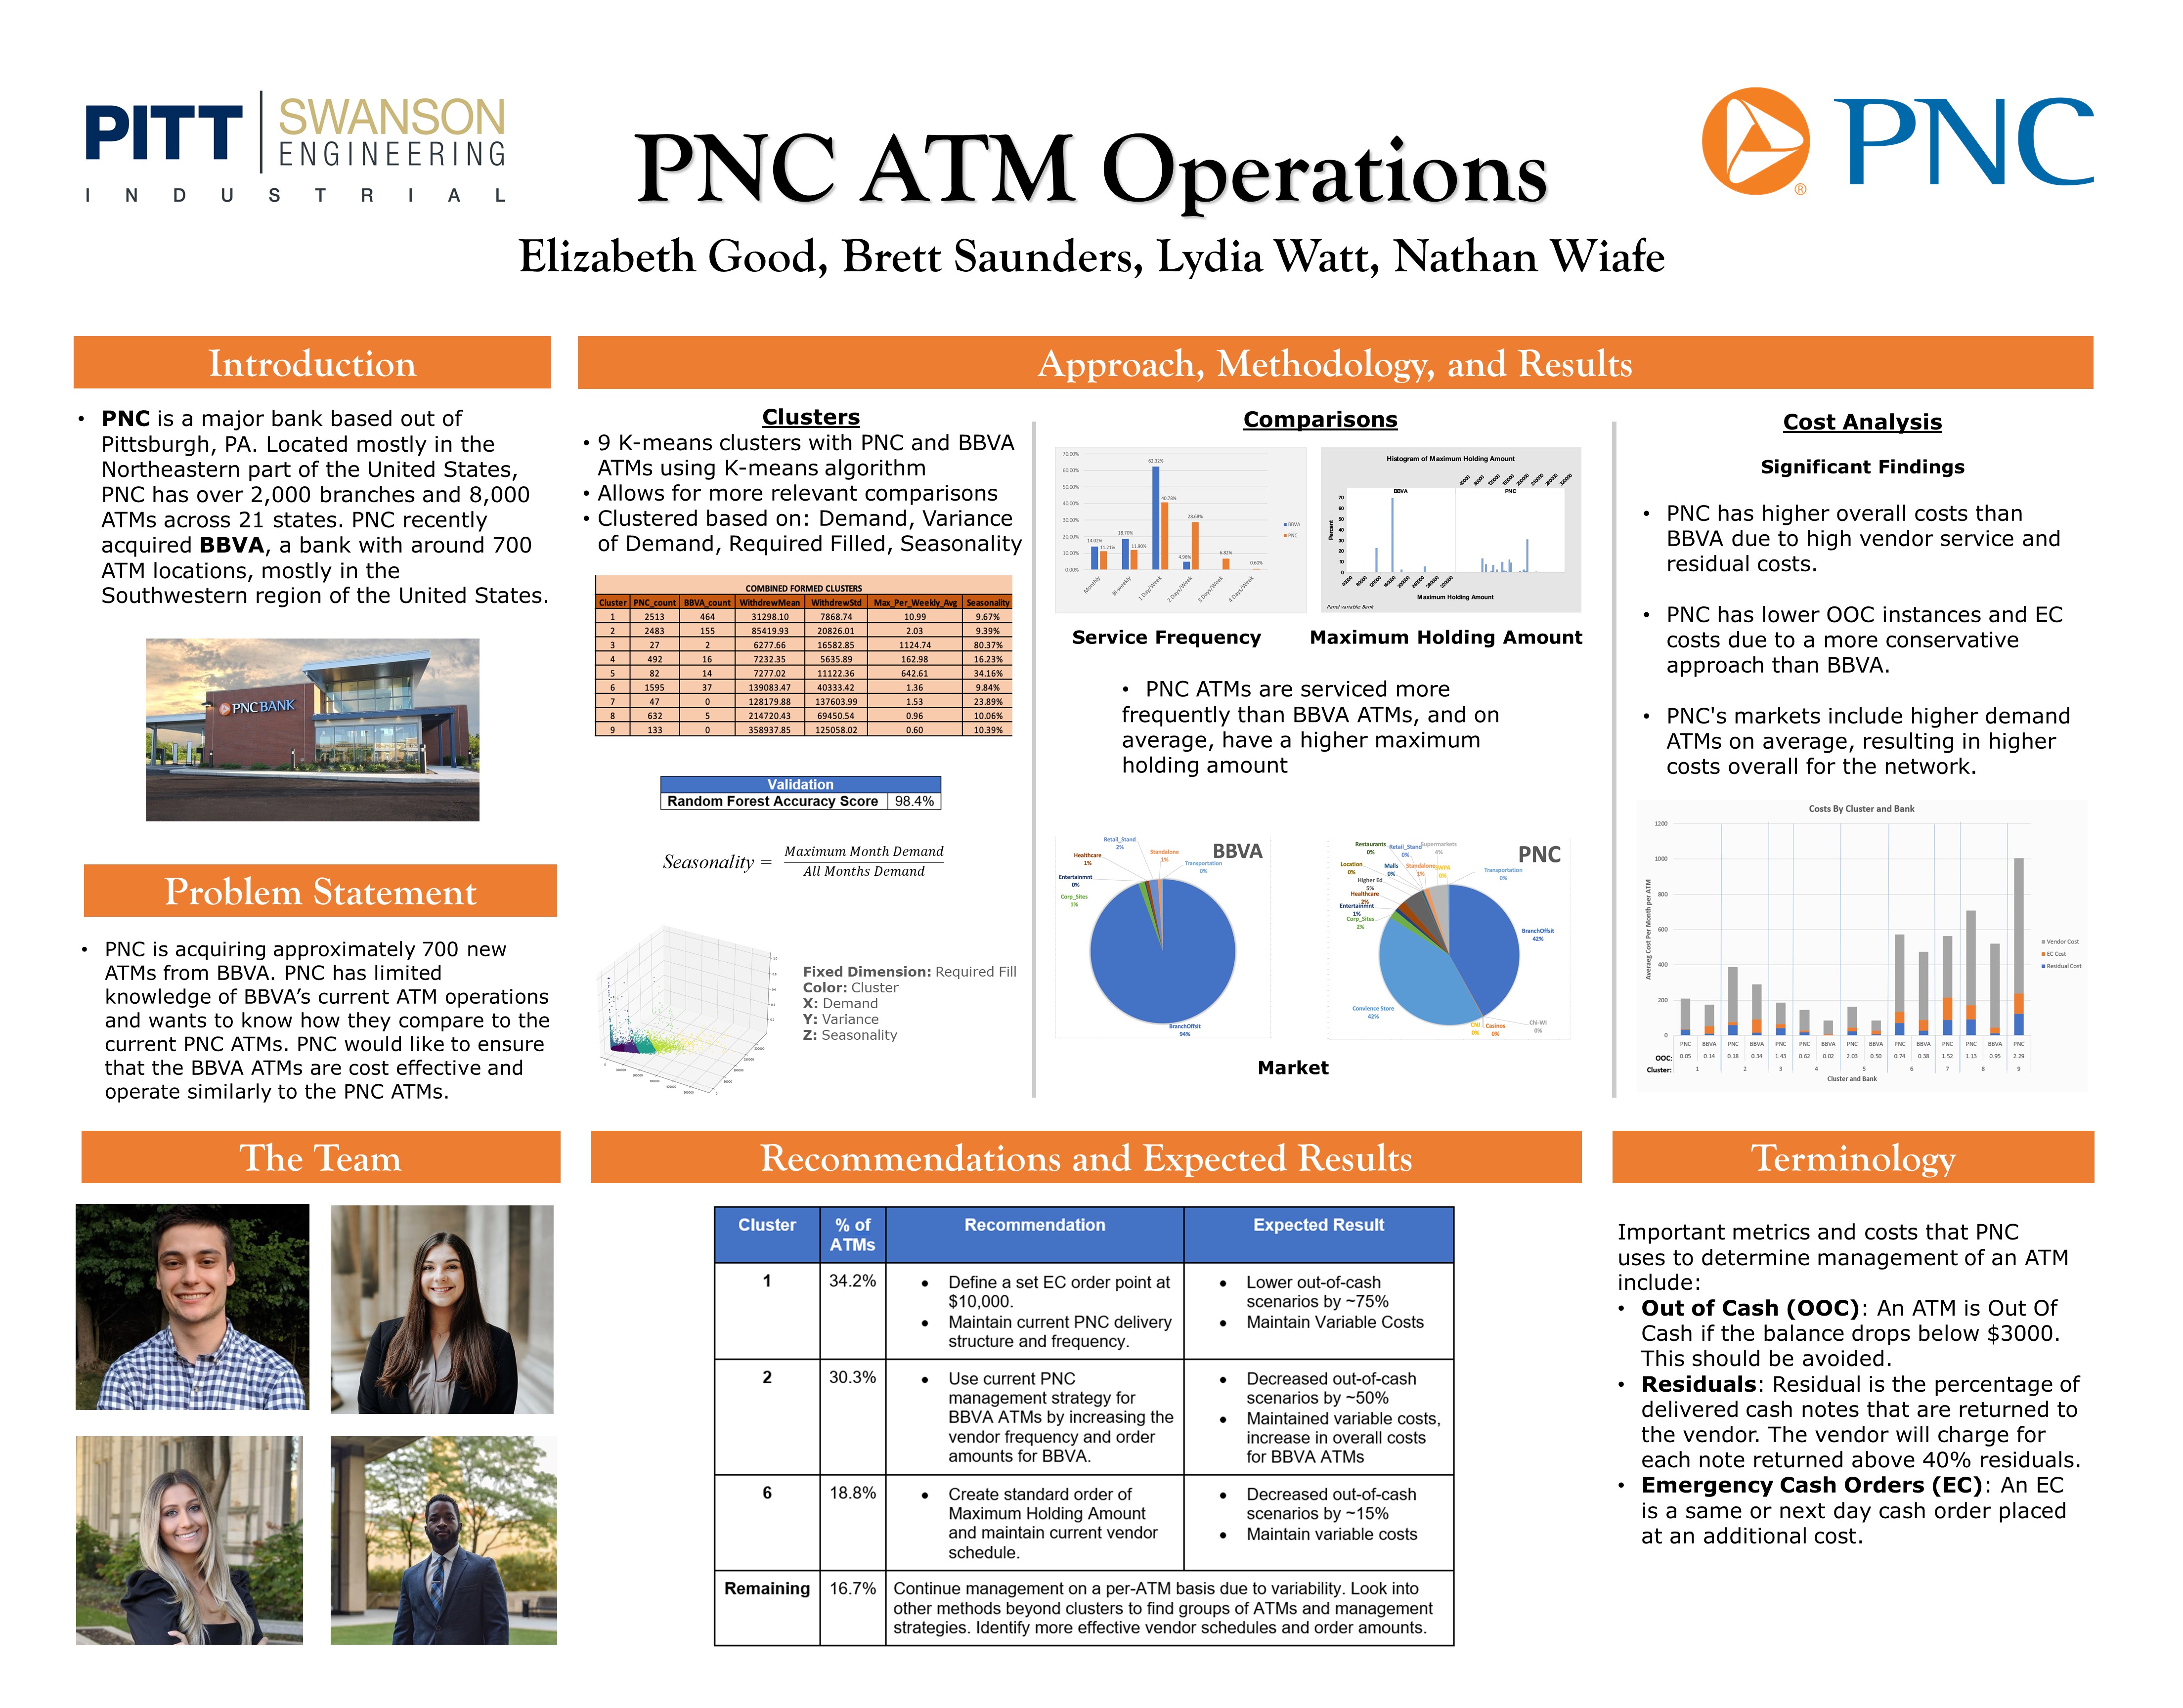
Project Summary
PNC recently acquired approximately 700 new ATMs from BBVA, and would like to ensure that the BBVA ATMs are cost effective and operate similarly to the PNC ATMs. In order to successfully integrate the new BBVA ATMs into PNC’s current ATM network, PNC has assigned the team the task of comparing both ATMs in terms of maximum holding amount, service frequency, market, demand distributions, and residual percentage distributions, as well as performing a cost analysis between BBVA’s ATMs and PNC’s ATMs.
To begin the comparisons, the team clustered the BBVA and PNC data together according to the K-means cluster method in R. From the cluster analysis, it was determined that 83% of all ATMs fell into three significant clusters: 1, 2 and 6. Through the cost analysis, the team was able to conclude that the BBVA ATMs have less total cost than the PNC ATMs, which is attributed to lower demand. Due to this, BBVA has a more aggressive approach to cash handling and relies more on Emergency Cash Orders compared to PNC. In turn, PNC’s conservative management strategy allows them to maintain less Out-of-Cash instances than BBVA but with higher total costs.
Using this knowledge and additional insight, the team suggests that PNC define a standardized emergency cash reorder point of $10,000.00 for cluster 1 ATMs. As for cluster 2, the team advises PNC to continue to manage the ATMs using the current management strategy and protocol and extend this management style to the recently acquired BBVA ATMs with similar performance metrics. Additionally, the team suggests increasing BBVA’s vendor delivery frequency to improve overall ATM performance. Lastly, for cluster 6, the team suggests PNC use a standard order of the maximum holding amount for each ATM while maintaining the same vendor delivery schedule.